Korean vs Immigrants from Europe Doctorate Degree
COMPARE
Korean
Immigrants from Europe
Doctorate Degree
Doctorate Degree Comparison
Koreans
Immigrants from Europe
1.7%
DOCTORATE DEGREE
14.2/ 100
METRIC RATING
213th/ 347
METRIC RANK
2.3%
DOCTORATE DEGREE
99.9/ 100
METRIC RATING
62nd/ 347
METRIC RANK
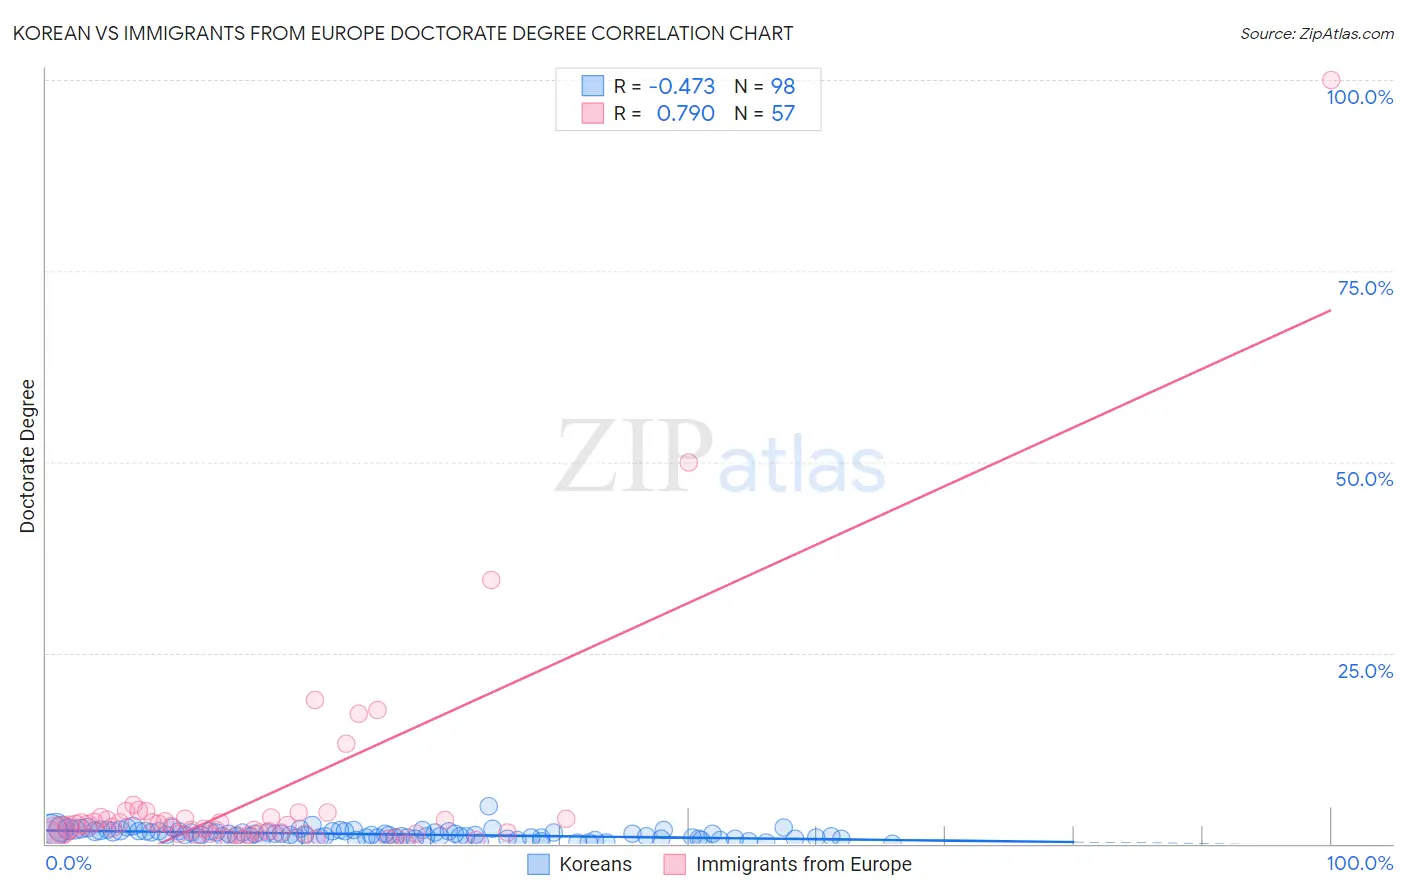
Korean vs Immigrants from Europe Doctorate Degree Correlation Chart
The statistical analysis conducted on geographies consisting of 500,370,759 people shows a moderate negative correlation between the proportion of Koreans and percentage of population with at least doctorate degree education in the United States with a correlation coefficient (R) of -0.473 and weighted average of 1.7%. Similarly, the statistical analysis conducted on geographies consisting of 532,096,533 people shows a strong positive correlation between the proportion of Immigrants from Europe and percentage of population with at least doctorate degree education in the United States with a correlation coefficient (R) of 0.790 and weighted average of 2.3%, a difference of 34.4%.
Doctorate Degree Correlation Summary
| Measurement | Korean | Immigrants from Europe |
| Minimum | 0.043% | 0.013% |
| Maximum | 5.0% | 100.0% |
| Range | 4.9% | 100.0% |
| Mean | 1.2% | 6.3% |
| Median | 1.2% | 2.4% |
| Interquartile 25% (IQ1) | 0.80% | 1.4% |
| Interquartile 75% (IQ3) | 1.7% | 3.4% |
| Interquartile Range (IQR) | 0.88% | 2.0% |
| Standard Deviation (Sample) | 0.69% | 15.1% |
| Standard Deviation (Population) | 0.68% | 15.0% |
Similar Demographics by Doctorate Degree
Demographics Similar to Koreans by Doctorate Degree
In terms of doctorate degree, the demographic groups most similar to Koreans are Pueblo (1.7%, a difference of 0.010%), Immigrants from South Eastern Asia (1.7%, a difference of 0.15%), Alaskan Athabascan (1.7%, a difference of 0.15%), Immigrants from Burma/Myanmar (1.7%, a difference of 0.25%), and Immigrants from Armenia (1.7%, a difference of 0.27%).
| Demographics | Rating | Rank | Doctorate Degree |
| Immigrants | Peru | 17.6 /100 | #206 | Poor 1.7% |
| Yugoslavians | 17.1 /100 | #207 | Poor 1.7% |
| Colombians | 16.1 /100 | #208 | Poor 1.7% |
| Immigrants | Western Africa | 15.4 /100 | #209 | Poor 1.7% |
| Tongans | 15.1 /100 | #210 | Poor 1.7% |
| Immigrants | Armenia | 15.1 /100 | #211 | Poor 1.7% |
| Immigrants | South Eastern Asia | 14.7 /100 | #212 | Poor 1.7% |
| Koreans | 14.2 /100 | #213 | Poor 1.7% |
| Pueblo | 14.2 /100 | #214 | Poor 1.7% |
| Alaskan Athabascans | 13.8 /100 | #215 | Poor 1.7% |
| Immigrants | Burma/Myanmar | 13.5 /100 | #216 | Poor 1.7% |
| Spanish Americans | 12.9 /100 | #217 | Poor 1.7% |
| Tlingit-Haida | 11.9 /100 | #218 | Poor 1.7% |
| Immigrants | Iraq | 10.7 /100 | #219 | Poor 1.7% |
| Immigrants | Uruguay | 9.2 /100 | #220 | Tragic 1.7% |
Demographics Similar to Immigrants from Europe by Doctorate Degree
In terms of doctorate degree, the demographic groups most similar to Immigrants from Europe are Laotian (2.3%, a difference of 0.090%), Immigrants from Greece (2.3%, a difference of 0.49%), Bhutanese (2.3%, a difference of 0.52%), Paraguayan (2.3%, a difference of 1.0%), and Argentinean (2.3%, a difference of 1.2%).
| Demographics | Rating | Rank | Doctorate Degree |
| Bolivians | 100.0 /100 | #55 | Exceptional 2.4% |
| Immigrants | Czechoslovakia | 100.0 /100 | #56 | Exceptional 2.4% |
| Immigrants | Ethiopia | 100.0 /100 | #57 | Exceptional 2.4% |
| Ethiopians | 99.9 /100 | #58 | Exceptional 2.3% |
| South Africans | 99.9 /100 | #59 | Exceptional 2.3% |
| Immigrants | Serbia | 99.9 /100 | #60 | Exceptional 2.3% |
| Bhutanese | 99.9 /100 | #61 | Exceptional 2.3% |
| Immigrants | Europe | 99.9 /100 | #62 | Exceptional 2.3% |
| Laotians | 99.9 /100 | #63 | Exceptional 2.3% |
| Immigrants | Greece | 99.9 /100 | #64 | Exceptional 2.3% |
| Paraguayans | 99.9 /100 | #65 | Exceptional 2.3% |
| Argentineans | 99.9 /100 | #66 | Exceptional 2.3% |
| Zimbabweans | 99.8 /100 | #67 | Exceptional 2.3% |
| Immigrants | Kazakhstan | 99.8 /100 | #68 | Exceptional 2.3% |
| Carpatho Rusyns | 99.8 /100 | #69 | Exceptional 2.3% |