Korean vs Immigrants from Russia Doctorate Degree
COMPARE
Korean
Immigrants from Russia
Doctorate Degree
Doctorate Degree Comparison
Koreans
Immigrants from Russia
1.7%
DOCTORATE DEGREE
14.2/ 100
METRIC RATING
213th/ 347
METRIC RANK
2.5%
DOCTORATE DEGREE
100.0/ 100
METRIC RATING
41st/ 347
METRIC RANK
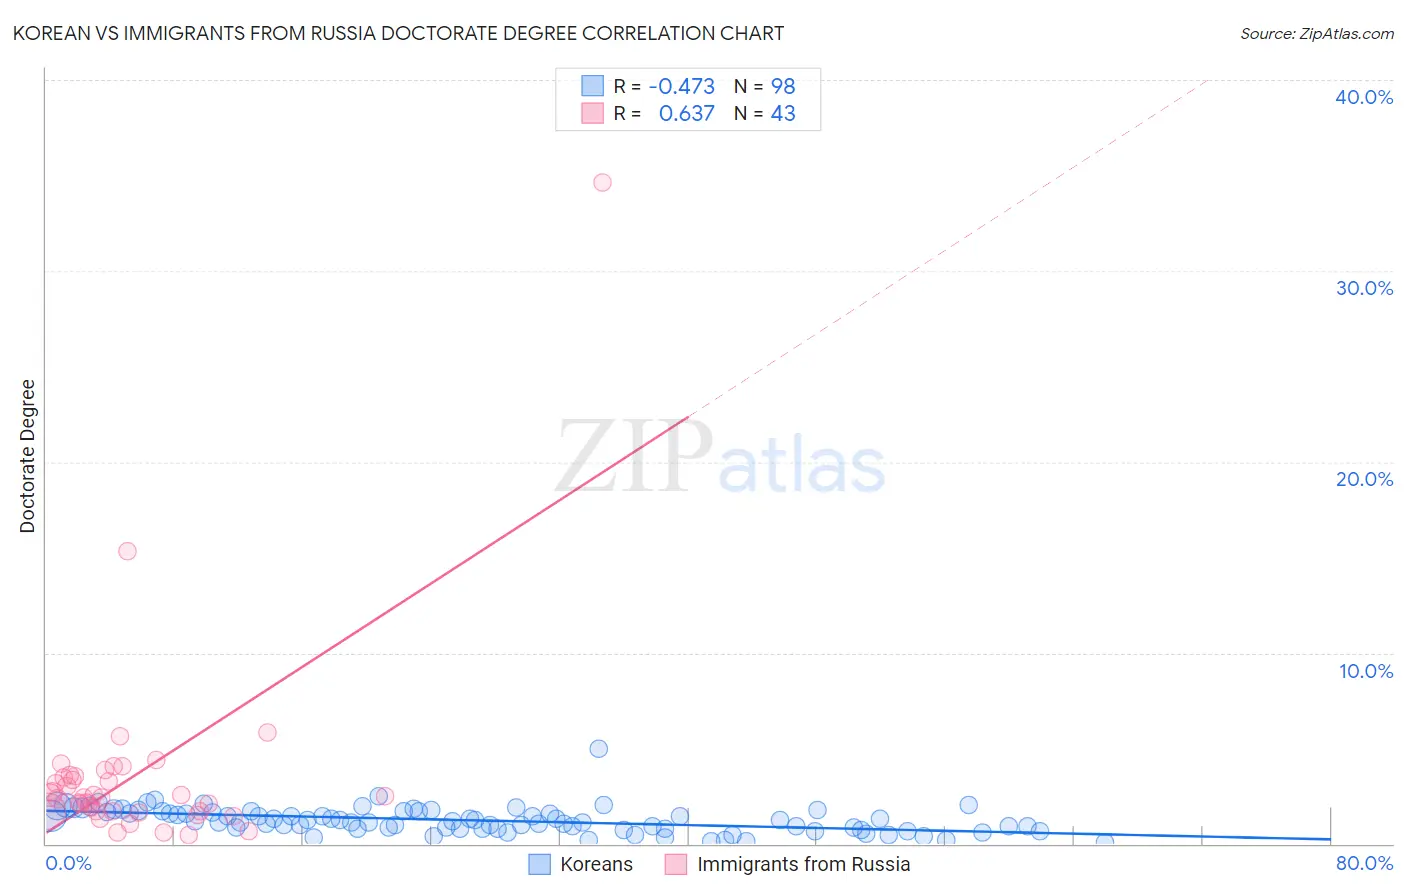
Korean vs Immigrants from Russia Doctorate Degree Correlation Chart
The statistical analysis conducted on geographies consisting of 500,370,759 people shows a moderate negative correlation between the proportion of Koreans and percentage of population with at least doctorate degree education in the United States with a correlation coefficient (R) of -0.473 and weighted average of 1.7%. Similarly, the statistical analysis conducted on geographies consisting of 346,147,144 people shows a significant positive correlation between the proportion of Immigrants from Russia and percentage of population with at least doctorate degree education in the United States with a correlation coefficient (R) of 0.637 and weighted average of 2.5%, a difference of 46.7%.
Doctorate Degree Correlation Summary
| Measurement | Korean | Immigrants from Russia |
| Minimum | 0.043% | 0.49% |
| Maximum | 5.0% | 34.6% |
| Range | 4.9% | 34.1% |
| Mean | 1.2% | 3.6% |
| Median | 1.2% | 2.4% |
| Interquartile 25% (IQ1) | 0.80% | 1.7% |
| Interquartile 75% (IQ3) | 1.7% | 3.5% |
| Interquartile Range (IQR) | 0.88% | 1.8% |
| Standard Deviation (Sample) | 0.69% | 5.4% |
| Standard Deviation (Population) | 0.68% | 5.3% |
Similar Demographics by Doctorate Degree
Demographics Similar to Koreans by Doctorate Degree
In terms of doctorate degree, the demographic groups most similar to Koreans are Pueblo (1.7%, a difference of 0.010%), Immigrants from South Eastern Asia (1.7%, a difference of 0.15%), Alaskan Athabascan (1.7%, a difference of 0.15%), Immigrants from Burma/Myanmar (1.7%, a difference of 0.25%), and Immigrants from Armenia (1.7%, a difference of 0.27%).
| Demographics | Rating | Rank | Doctorate Degree |
| Immigrants | Peru | 17.6 /100 | #206 | Poor 1.7% |
| Yugoslavians | 17.1 /100 | #207 | Poor 1.7% |
| Colombians | 16.1 /100 | #208 | Poor 1.7% |
| Immigrants | Western Africa | 15.4 /100 | #209 | Poor 1.7% |
| Tongans | 15.1 /100 | #210 | Poor 1.7% |
| Immigrants | Armenia | 15.1 /100 | #211 | Poor 1.7% |
| Immigrants | South Eastern Asia | 14.7 /100 | #212 | Poor 1.7% |
| Koreans | 14.2 /100 | #213 | Poor 1.7% |
| Pueblo | 14.2 /100 | #214 | Poor 1.7% |
| Alaskan Athabascans | 13.8 /100 | #215 | Poor 1.7% |
| Immigrants | Burma/Myanmar | 13.5 /100 | #216 | Poor 1.7% |
| Spanish Americans | 12.9 /100 | #217 | Poor 1.7% |
| Tlingit-Haida | 11.9 /100 | #218 | Poor 1.7% |
| Immigrants | Iraq | 10.7 /100 | #219 | Poor 1.7% |
| Immigrants | Uruguay | 9.2 /100 | #220 | Tragic 1.7% |
Demographics Similar to Immigrants from Russia by Doctorate Degree
In terms of doctorate degree, the demographic groups most similar to Immigrants from Russia are Estonian (2.5%, a difference of 0.33%), New Zealander (2.5%, a difference of 0.63%), Immigrants from Ireland (2.5%, a difference of 0.74%), Russian (2.6%, a difference of 1.2%), and Immigrants from Kuwait (2.6%, a difference of 1.4%).
| Demographics | Rating | Rank | Doctorate Degree |
| Cypriots | 100.0 /100 | #34 | Exceptional 2.6% |
| Immigrants | Malaysia | 100.0 /100 | #35 | Exceptional 2.6% |
| Immigrants | Spain | 100.0 /100 | #36 | Exceptional 2.6% |
| Immigrants | Kuwait | 100.0 /100 | #37 | Exceptional 2.6% |
| Russians | 100.0 /100 | #38 | Exceptional 2.6% |
| Immigrants | Ireland | 100.0 /100 | #39 | Exceptional 2.5% |
| Estonians | 100.0 /100 | #40 | Exceptional 2.5% |
| Immigrants | Russia | 100.0 /100 | #41 | Exceptional 2.5% |
| New Zealanders | 100.0 /100 | #42 | Exceptional 2.5% |
| Soviet Union | 100.0 /100 | #43 | Exceptional 2.5% |
| Immigrants | Netherlands | 100.0 /100 | #44 | Exceptional 2.5% |
| Immigrants | South Africa | 100.0 /100 | #45 | Exceptional 2.4% |
| Immigrants | Austria | 100.0 /100 | #46 | Exceptional 2.4% |
| Immigrants | Western Europe | 100.0 /100 | #47 | Exceptional 2.4% |
| Asians | 100.0 /100 | #48 | Exceptional 2.4% |