Immigrants from Vietnam vs Cheyenne Bachelor's Degree
COMPARE
Immigrants from Vietnam
Cheyenne
Bachelor's Degree
Bachelor's Degree Comparison
Immigrants from Vietnam
Cheyenne
37.1%
BACHELOR'S DEGREE
32.1/ 100
METRIC RATING
192nd/ 347
METRIC RANK
29.4%
BACHELOR'S DEGREE
0.0/ 100
METRIC RATING
310th/ 347
METRIC RANK
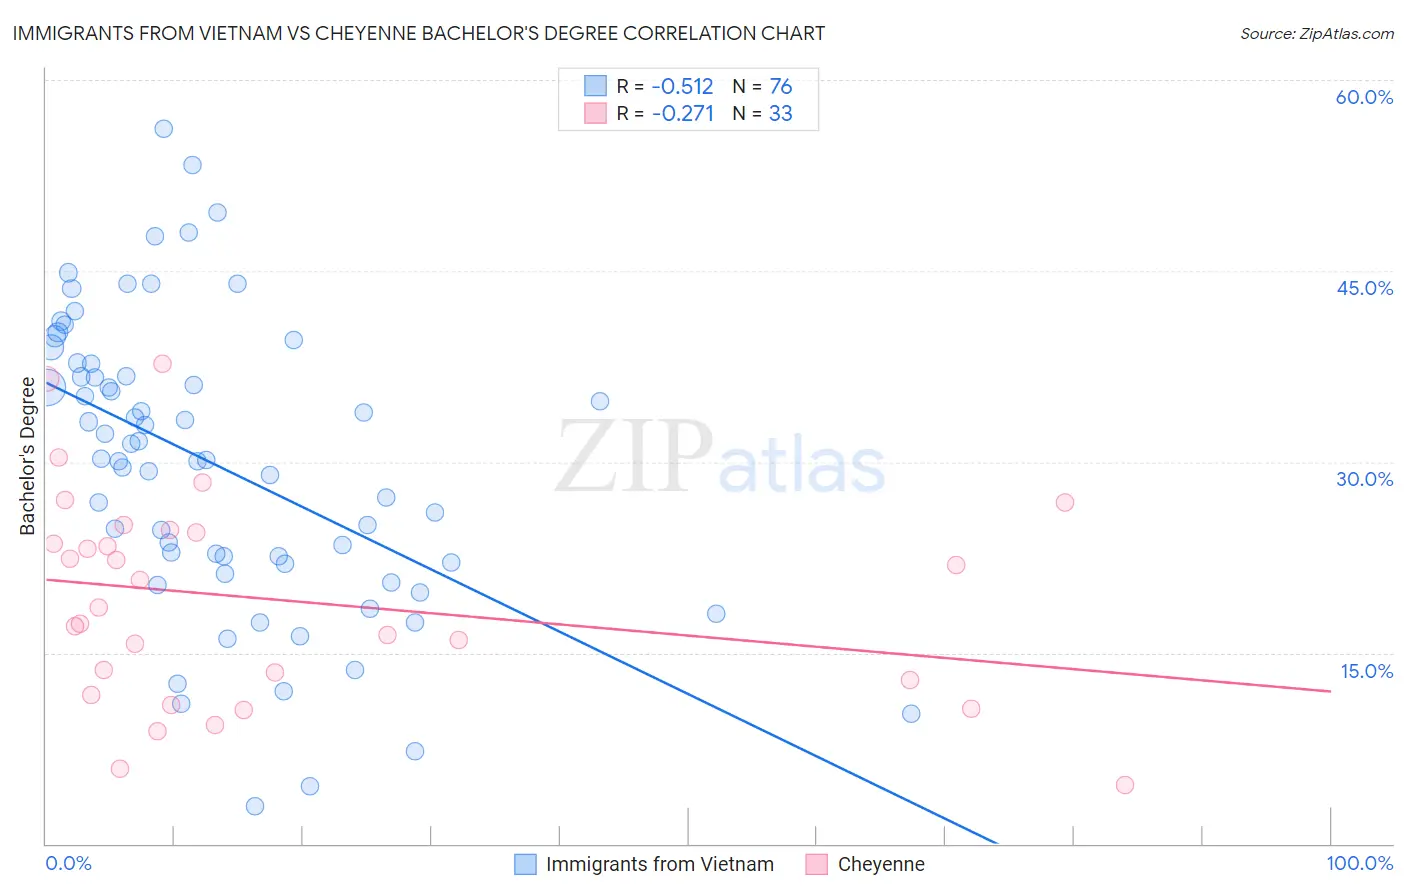
Immigrants from Vietnam vs Cheyenne Bachelor's Degree Correlation Chart
The statistical analysis conducted on geographies consisting of 404,813,779 people shows a substantial negative correlation between the proportion of Immigrants from Vietnam and percentage of population with at least bachelor's degree education in the United States with a correlation coefficient (R) of -0.512 and weighted average of 37.1%. Similarly, the statistical analysis conducted on geographies consisting of 80,718,972 people shows a weak negative correlation between the proportion of Cheyenne and percentage of population with at least bachelor's degree education in the United States with a correlation coefficient (R) of -0.271 and weighted average of 29.4%, a difference of 26.1%.
Bachelor's Degree Correlation Summary
| Measurement | Immigrants from Vietnam | Cheyenne |
| Minimum | 2.9% | 4.6% |
| Maximum | 56.2% | 37.7% |
| Range | 53.3% | 33.1% |
| Mean | 29.7% | 19.1% |
| Median | 30.2% | 18.6% |
| Interquartile 25% (IQ1) | 22.0% | 12.3% |
| Interquartile 75% (IQ3) | 37.2% | 24.6% |
| Interquartile Range (IQR) | 15.2% | 12.3% |
| Standard Deviation (Sample) | 11.5% | 8.2% |
| Standard Deviation (Population) | 11.4% | 8.1% |
Similar Demographics by Bachelor's Degree
Demographics Similar to Immigrants from Vietnam by Bachelor's Degree
In terms of bachelor's degree, the demographic groups most similar to Immigrants from Vietnam are Yugoslavian (37.1%, a difference of 0.060%), Nigerian (37.2%, a difference of 0.20%), Swiss (37.2%, a difference of 0.22%), Belgian (37.0%, a difference of 0.25%), and Korean (37.0%, a difference of 0.27%).
| Demographics | Rating | Rank | Bachelor's Degree |
| Immigrants | Peru | 41.3 /100 | #185 | Average 37.5% |
| Norwegians | 40.4 /100 | #186 | Average 37.5% |
| English | 39.7 /100 | #187 | Fair 37.4% |
| Immigrants | Oceania | 37.3 /100 | #188 | Fair 37.3% |
| Slovaks | 36.9 /100 | #189 | Fair 37.3% |
| Swiss | 34.1 /100 | #190 | Fair 37.2% |
| Nigerians | 33.9 /100 | #191 | Fair 37.2% |
| Immigrants | Vietnam | 32.1 /100 | #192 | Fair 37.1% |
| Yugoslavians | 31.5 /100 | #193 | Fair 37.1% |
| Belgians | 29.9 /100 | #194 | Fair 37.0% |
| Koreans | 29.8 /100 | #195 | Fair 37.0% |
| Celtics | 29.5 /100 | #196 | Fair 37.0% |
| Czechoslovakians | 29.2 /100 | #197 | Fair 37.0% |
| Welsh | 29.1 /100 | #198 | Fair 37.0% |
| Immigrants | Costa Rica | 27.4 /100 | #199 | Fair 36.9% |
Demographics Similar to Cheyenne by Bachelor's Degree
In terms of bachelor's degree, the demographic groups most similar to Cheyenne are Choctaw (29.4%, a difference of 0.070%), Seminole (29.4%, a difference of 0.13%), Alaska Native (29.4%, a difference of 0.31%), Hispanic or Latino (29.6%, a difference of 0.47%), and Shoshone (29.3%, a difference of 0.60%).
| Demographics | Rating | Rank | Bachelor's Degree |
| Bangladeshis | 0.0 /100 | #303 | Tragic 30.2% |
| Cherokee | 0.0 /100 | #304 | Tragic 30.2% |
| Immigrants | Latin America | 0.0 /100 | #305 | Tragic 30.1% |
| Immigrants | Yemen | 0.0 /100 | #306 | Tragic 29.9% |
| Nepalese | 0.0 /100 | #307 | Tragic 29.9% |
| Cajuns | 0.0 /100 | #308 | Tragic 29.6% |
| Hispanics or Latinos | 0.0 /100 | #309 | Tragic 29.6% |
| Cheyenne | 0.0 /100 | #310 | Tragic 29.4% |
| Choctaw | 0.0 /100 | #311 | Tragic 29.4% |
| Seminole | 0.0 /100 | #312 | Tragic 29.4% |
| Alaska Natives | 0.0 /100 | #313 | Tragic 29.4% |
| Shoshone | 0.0 /100 | #314 | Tragic 29.3% |
| Immigrants | Cabo Verde | 0.0 /100 | #315 | Tragic 29.2% |
| Sioux | 0.0 /100 | #316 | Tragic 29.1% |
| Colville | 0.0 /100 | #317 | Tragic 29.0% |