Immigrants from Northern Europe vs Austrian Bachelor's Degree
COMPARE
Immigrants from Northern Europe
Austrian
Bachelor's Degree
Bachelor's Degree Comparison
Immigrants from Northern Europe
Austrians
45.6%
BACHELOR'S DEGREE
100.0/ 100
METRIC RATING
33rd/ 347
METRIC RANK
40.6%
BACHELOR'S DEGREE
95.5/ 100
METRIC RATING
117th/ 347
METRIC RANK
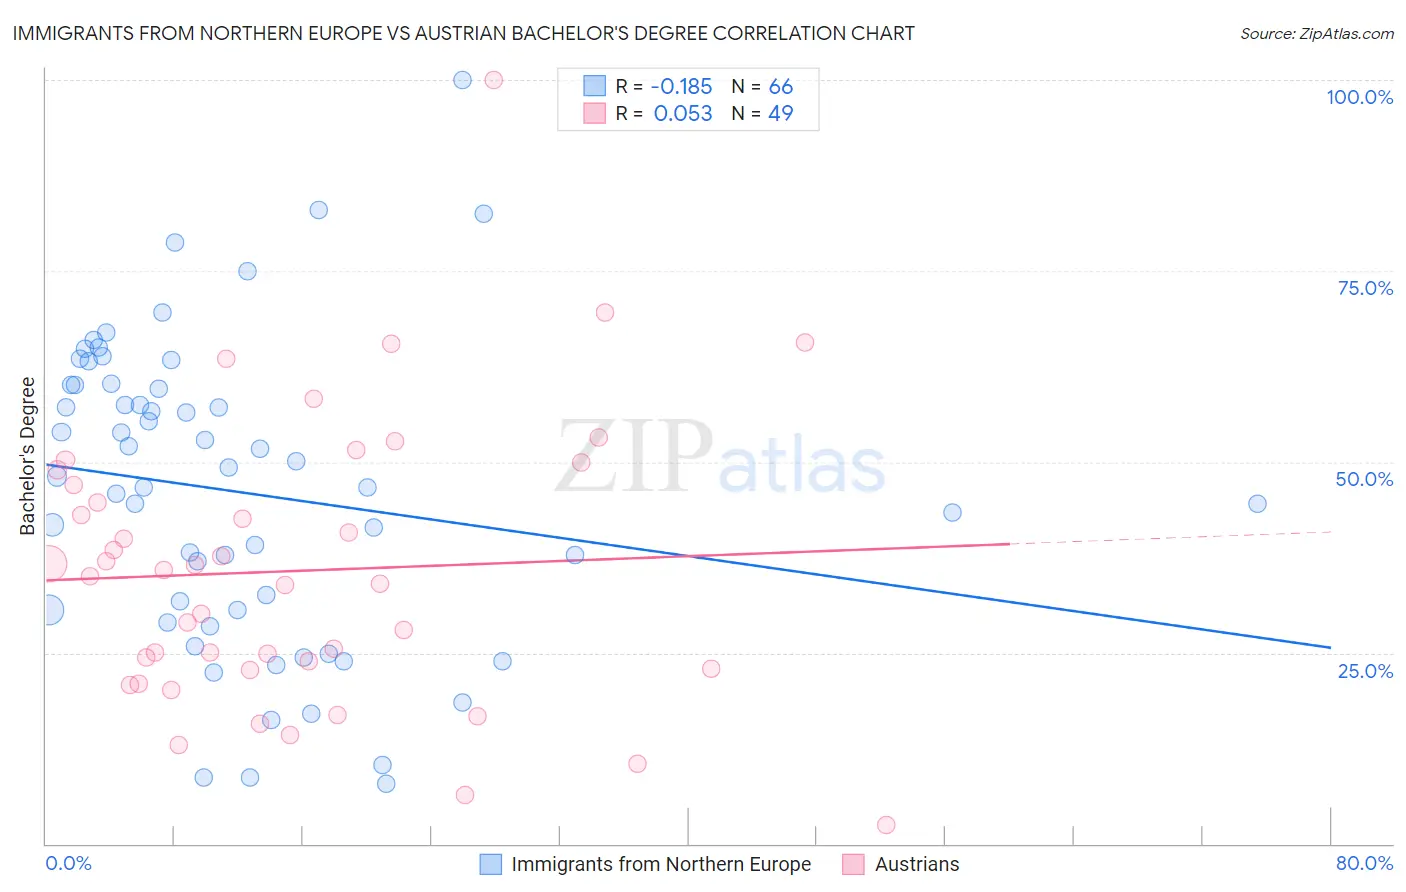
Immigrants from Northern Europe vs Austrian Bachelor's Degree Correlation Chart
The statistical analysis conducted on geographies consisting of 477,184,497 people shows a poor negative correlation between the proportion of Immigrants from Northern Europe and percentage of population with at least bachelor's degree education in the United States with a correlation coefficient (R) of -0.185 and weighted average of 45.6%. Similarly, the statistical analysis conducted on geographies consisting of 452,047,267 people shows a slight positive correlation between the proportion of Austrians and percentage of population with at least bachelor's degree education in the United States with a correlation coefficient (R) of 0.053 and weighted average of 40.6%, a difference of 12.3%.
Bachelor's Degree Correlation Summary
| Measurement | Immigrants from Northern Europe | Austrian |
| Minimum | 7.8% | 2.4% |
| Maximum | 100.0% | 100.0% |
| Range | 92.2% | 97.6% |
| Mean | 46.0% | 35.7% |
| Median | 47.4% | 35.1% |
| Interquartile 25% (IQ1) | 30.6% | 22.9% |
| Interquartile 75% (IQ3) | 60.1% | 48.0% |
| Interquartile Range (IQR) | 29.5% | 25.1% |
| Standard Deviation (Sample) | 20.0% | 18.7% |
| Standard Deviation (Population) | 19.8% | 18.5% |
Similar Demographics by Bachelor's Degree
Demographics Similar to Immigrants from Northern Europe by Bachelor's Degree
In terms of bachelor's degree, the demographic groups most similar to Immigrants from Northern Europe are Immigrants from Denmark (45.4%, a difference of 0.45%), Immigrants from Russia (45.4%, a difference of 0.48%), Mongolian (45.4%, a difference of 0.50%), Russian (45.3%, a difference of 0.65%), and Immigrants from Turkey (46.0%, a difference of 0.70%).
| Demographics | Rating | Rank | Bachelor's Degree |
| Immigrants | Japan | 100.0 /100 | #26 | Exceptional 46.8% |
| Immigrants | France | 100.0 /100 | #27 | Exceptional 46.4% |
| Turks | 100.0 /100 | #28 | Exceptional 46.2% |
| Israelis | 100.0 /100 | #29 | Exceptional 46.1% |
| Immigrants | Sri Lanka | 100.0 /100 | #30 | Exceptional 46.1% |
| Latvians | 100.0 /100 | #31 | Exceptional 46.1% |
| Immigrants | Turkey | 100.0 /100 | #32 | Exceptional 46.0% |
| Immigrants | Northern Europe | 100.0 /100 | #33 | Exceptional 45.6% |
| Immigrants | Denmark | 100.0 /100 | #34 | Exceptional 45.4% |
| Immigrants | Russia | 100.0 /100 | #35 | Exceptional 45.4% |
| Mongolians | 100.0 /100 | #36 | Exceptional 45.4% |
| Russians | 100.0 /100 | #37 | Exceptional 45.3% |
| Bulgarians | 100.0 /100 | #38 | Exceptional 45.3% |
| Immigrants | Latvia | 100.0 /100 | #39 | Exceptional 45.1% |
| Immigrants | Belarus | 100.0 /100 | #40 | Exceptional 45.0% |
Demographics Similar to Austrians by Bachelor's Degree
In terms of bachelor's degree, the demographic groups most similar to Austrians are Croatian (40.6%, a difference of 0.020%), Immigrants from Uganda (40.7%, a difference of 0.10%), Palestinian (40.7%, a difference of 0.15%), Immigrants from Syria (40.5%, a difference of 0.34%), and Afghan (40.8%, a difference of 0.39%).
| Demographics | Rating | Rank | Bachelor's Degree |
| Albanians | 96.5 /100 | #110 | Exceptional 40.9% |
| Immigrants | Chile | 96.4 /100 | #111 | Exceptional 40.8% |
| Ugandans | 96.3 /100 | #112 | Exceptional 40.8% |
| Brazilians | 96.3 /100 | #113 | Exceptional 40.8% |
| Afghans | 96.2 /100 | #114 | Exceptional 40.8% |
| Palestinians | 95.8 /100 | #115 | Exceptional 40.7% |
| Immigrants | Uganda | 95.7 /100 | #116 | Exceptional 40.7% |
| Austrians | 95.5 /100 | #117 | Exceptional 40.6% |
| Croatians | 95.5 /100 | #118 | Exceptional 40.6% |
| Immigrants | Syria | 94.9 /100 | #119 | Exceptional 40.5% |
| Venezuelans | 94.7 /100 | #120 | Exceptional 40.5% |
| Moroccans | 94.6 /100 | #121 | Exceptional 40.5% |
| Immigrants | Albania | 94.4 /100 | #122 | Exceptional 40.4% |
| Lebanese | 94.3 /100 | #123 | Exceptional 40.4% |
| Immigrants | Eritrea | 94.3 /100 | #124 | Exceptional 40.4% |