Korean vs Austrian Male Unemployment
COMPARE
Korean
Austrian
Male Unemployment
Male Unemployment Comparison
Koreans
Austrians
5.3%
MALE UNEMPLOYMENT
34.9/ 100
METRIC RATING
185th/ 347
METRIC RANK
4.9%
MALE UNEMPLOYMENT
98.9/ 100
METRIC RATING
47th/ 347
METRIC RANK
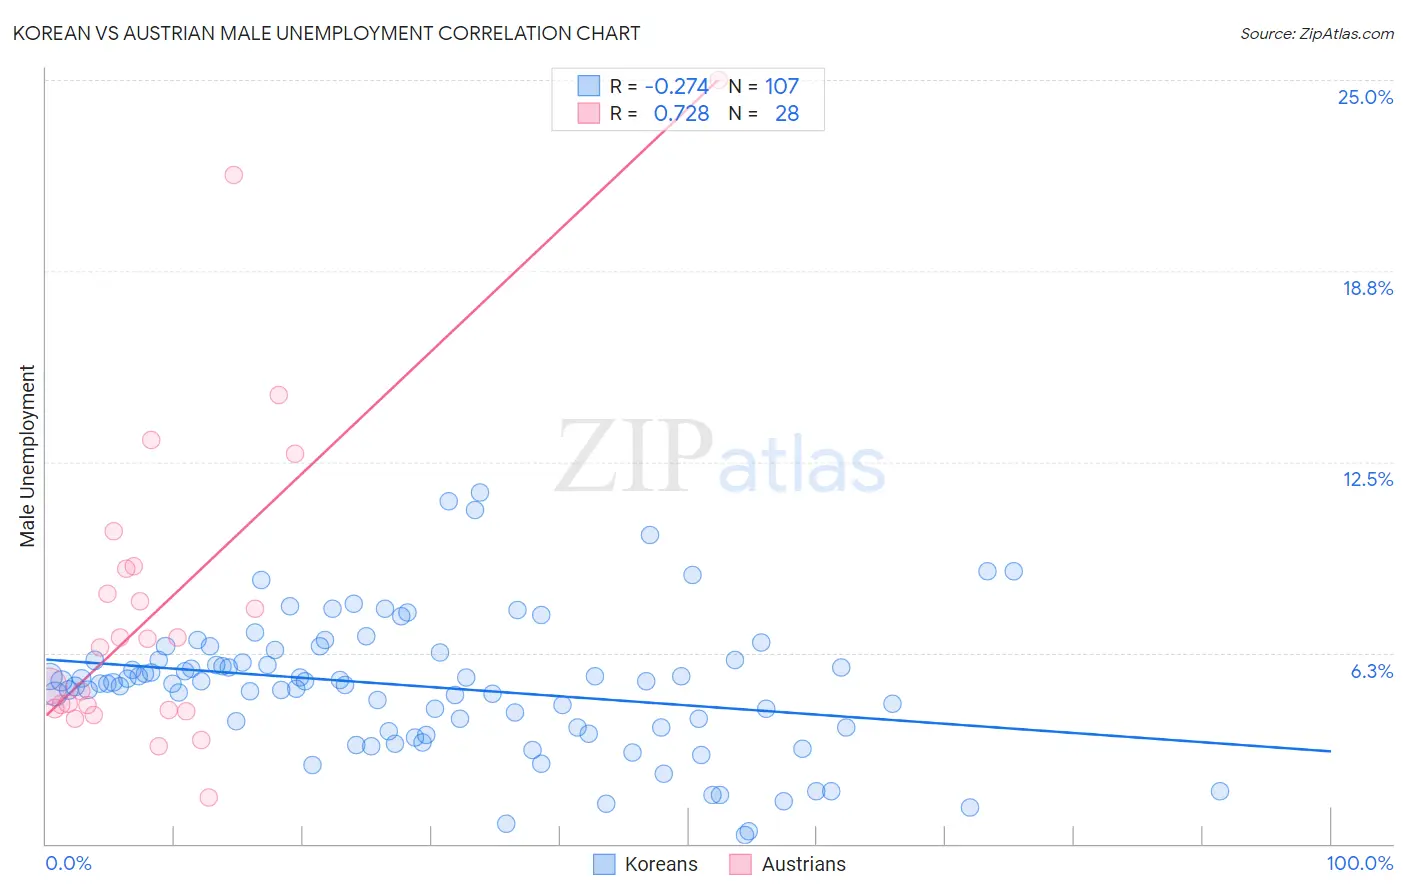
Korean vs Austrian Male Unemployment Correlation Chart
The statistical analysis conducted on geographies consisting of 506,883,728 people shows a weak negative correlation between the proportion of Koreans and unemployment rate among males in the United States with a correlation coefficient (R) of -0.274 and weighted average of 5.3%. Similarly, the statistical analysis conducted on geographies consisting of 448,962,183 people shows a strong positive correlation between the proportion of Austrians and unemployment rate among males in the United States with a correlation coefficient (R) of 0.728 and weighted average of 4.9%, a difference of 8.0%.
Male Unemployment Correlation Summary
| Measurement | Korean | Austrian |
| Minimum | 0.30% | 1.5% |
| Maximum | 11.5% | 25.0% |
| Range | 11.2% | 23.5% |
| Mean | 5.1% | 7.8% |
| Median | 5.3% | 6.6% |
| Interquartile 25% (IQ1) | 3.8% | 4.4% |
| Interquartile 75% (IQ3) | 6.0% | 9.0% |
| Interquartile Range (IQR) | 2.2% | 4.6% |
| Standard Deviation (Sample) | 2.2% | 5.4% |
| Standard Deviation (Population) | 2.2% | 5.3% |
Similar Demographics by Male Unemployment
Demographics Similar to Koreans by Male Unemployment
In terms of male unemployment, the demographic groups most similar to Koreans are Spaniard (5.3%, a difference of 0.010%), Taiwanese (5.3%, a difference of 0.17%), Potawatomi (5.3%, a difference of 0.18%), Immigrants from Afghanistan (5.3%, a difference of 0.19%), and Iraqi (5.4%, a difference of 0.22%).
| Demographics | Rating | Rank | Male Unemployment |
| Osage | 42.5 /100 | #178 | Average 5.3% |
| Immigrants | Oceania | 40.8 /100 | #179 | Average 5.3% |
| Malaysians | 39.6 /100 | #180 | Fair 5.3% |
| Immigrants | Afghanistan | 37.9 /100 | #181 | Fair 5.3% |
| Potawatomi | 37.8 /100 | #182 | Fair 5.3% |
| Taiwanese | 37.6 /100 | #183 | Fair 5.3% |
| Spaniards | 35.1 /100 | #184 | Fair 5.3% |
| Koreans | 34.9 /100 | #185 | Fair 5.3% |
| Iraqis | 31.6 /100 | #186 | Fair 5.4% |
| Costa Ricans | 31.3 /100 | #187 | Fair 5.4% |
| Arabs | 30.2 /100 | #188 | Fair 5.4% |
| Immigrants | South America | 29.4 /100 | #189 | Fair 5.4% |
| Immigrants | Uganda | 28.8 /100 | #190 | Fair 5.4% |
| Immigrants | South Eastern Asia | 28.2 /100 | #191 | Fair 5.4% |
| Immigrants | Belarus | 26.0 /100 | #192 | Fair 5.4% |
Demographics Similar to Austrians by Male Unemployment
In terms of male unemployment, the demographic groups most similar to Austrians are Immigrants from Scotland (4.9%, a difference of 0.020%), Polish (4.9%, a difference of 0.030%), Croatian (4.9%, a difference of 0.040%), Bhutanese (4.9%, a difference of 0.070%), and Slovene (5.0%, a difference of 0.070%).
| Demographics | Rating | Rank | Male Unemployment |
| Northern Europeans | 99.3 /100 | #40 | Exceptional 4.9% |
| Chinese | 99.3 /100 | #41 | Exceptional 4.9% |
| Immigrants | Belgium | 99.2 /100 | #42 | Exceptional 4.9% |
| Immigrants | Japan | 99.2 /100 | #43 | Exceptional 4.9% |
| Immigrants | Korea | 99.1 /100 | #44 | Exceptional 4.9% |
| Immigrants | Zimbabwe | 99.0 /100 | #45 | Exceptional 4.9% |
| Bhutanese | 98.9 /100 | #46 | Exceptional 4.9% |
| Austrians | 98.9 /100 | #47 | Exceptional 4.9% |
| Immigrants | Scotland | 98.9 /100 | #48 | Exceptional 4.9% |
| Poles | 98.9 /100 | #49 | Exceptional 4.9% |
| Croatians | 98.9 /100 | #50 | Exceptional 4.9% |
| Slovenes | 98.8 /100 | #51 | Exceptional 5.0% |
| Irish | 98.8 /100 | #52 | Exceptional 5.0% |
| Jordanians | 98.8 /100 | #53 | Exceptional 5.0% |
| Yugoslavians | 98.7 /100 | #54 | Exceptional 5.0% |