Immigrants from Morocco vs Armenian Nursery School
COMPARE
Immigrants from Morocco
Armenian
Nursery School
Nursery School Comparison
Immigrants from Morocco
Armenians
97.8%
NURSERY SCHOOL
5.1/ 100
METRIC RATING
219th/ 347
METRIC RANK
97.6%
NURSERY SCHOOL
0.4/ 100
METRIC RATING
259th/ 347
METRIC RANK
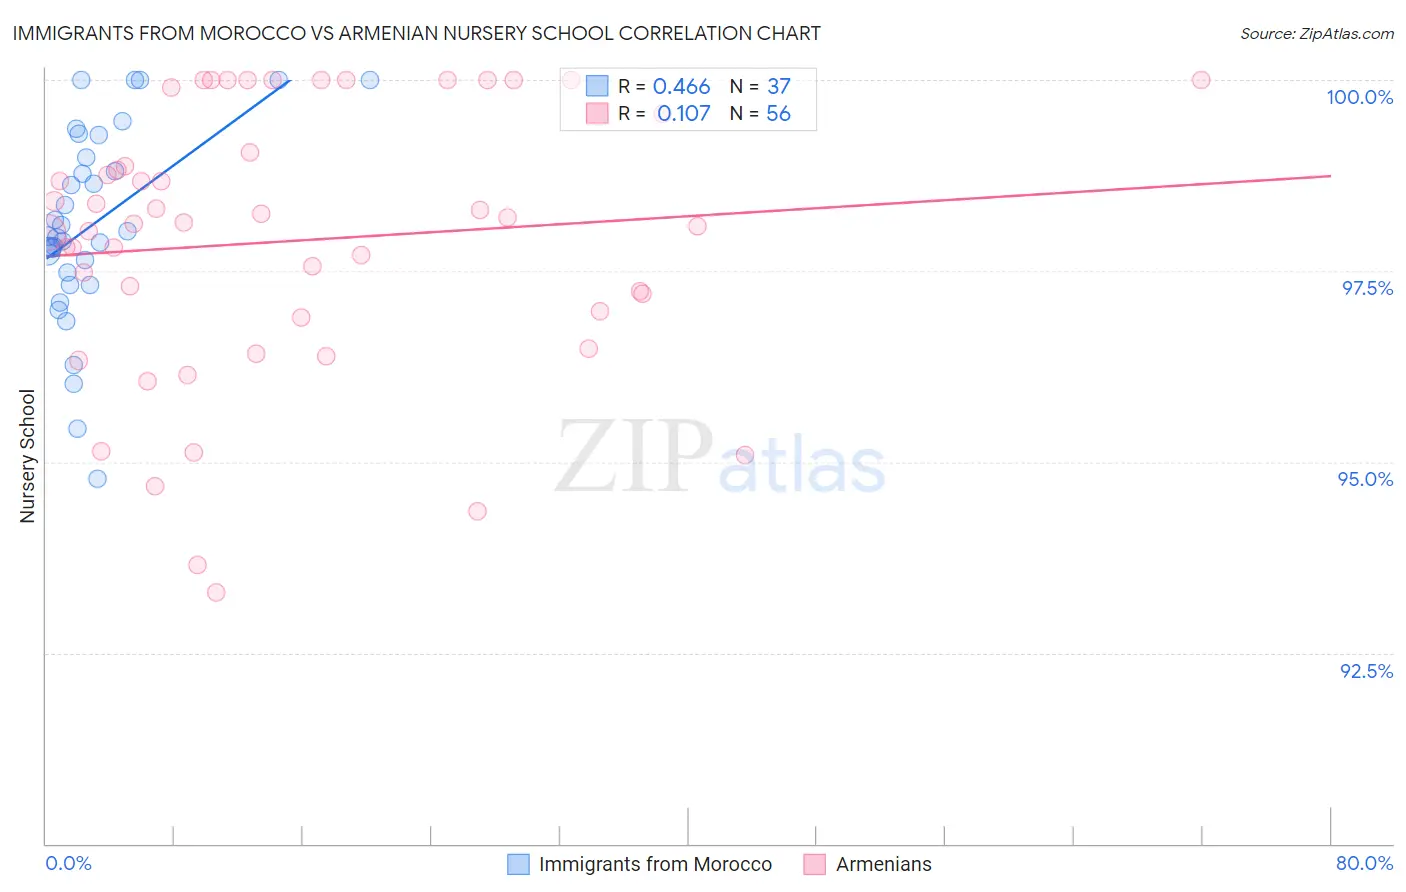
Immigrants from Morocco vs Armenian Nursery School Correlation Chart
The statistical analysis conducted on geographies consisting of 178,912,438 people shows a moderate positive correlation between the proportion of Immigrants from Morocco and percentage of population with at least nursery school education in the United States with a correlation coefficient (R) of 0.466 and weighted average of 97.8%. Similarly, the statistical analysis conducted on geographies consisting of 310,954,660 people shows a poor positive correlation between the proportion of Armenians and percentage of population with at least nursery school education in the United States with a correlation coefficient (R) of 0.107 and weighted average of 97.6%, a difference of 0.19%.
Nursery School Correlation Summary
| Measurement | Immigrants from Morocco | Armenian |
| Minimum | 94.8% | 93.3% |
| Maximum | 100.0% | 100.0% |
| Range | 5.2% | 6.7% |
| Mean | 98.1% | 97.9% |
| Median | 98.0% | 98.1% |
| Interquartile 25% (IQ1) | 97.4% | 96.9% |
| Interquartile 75% (IQ3) | 99.1% | 99.3% |
| Interquartile Range (IQR) | 1.7% | 2.4% |
| Standard Deviation (Sample) | 1.3% | 1.8% |
| Standard Deviation (Population) | 1.3% | 1.7% |
Similar Demographics by Nursery School
Demographics Similar to Immigrants from Morocco by Nursery School
In terms of nursery school, the demographic groups most similar to Immigrants from Morocco are Immigrants from Panama (97.8%, a difference of 0.0%), Immigrants from Zaire (97.8%, a difference of 0.010%), Tongan (97.8%, a difference of 0.010%), Samoan (97.8%, a difference of 0.020%), and Immigrants from Syria (97.7%, a difference of 0.020%).
| Demographics | Rating | Rank | Nursery School |
| Immigrants | Bahamas | 8.6 /100 | #212 | Tragic 97.8% |
| Moroccans | 8.3 /100 | #213 | Tragic 97.8% |
| South American Indians | 8.0 /100 | #214 | Tragic 97.8% |
| Bahamians | 7.4 /100 | #215 | Tragic 97.8% |
| Uruguayans | 7.1 /100 | #216 | Tragic 97.8% |
| Samoans | 6.3 /100 | #217 | Tragic 97.8% |
| Immigrants | Panama | 5.3 /100 | #218 | Tragic 97.8% |
| Immigrants | Morocco | 5.1 /100 | #219 | Tragic 97.8% |
| Immigrants | Zaire | 4.4 /100 | #220 | Tragic 97.8% |
| Tongans | 4.3 /100 | #221 | Tragic 97.8% |
| Immigrants | Syria | 4.0 /100 | #222 | Tragic 97.7% |
| Immigrants | Sudan | 3.9 /100 | #223 | Tragic 97.7% |
| Immigrants | Nepal | 3.6 /100 | #224 | Tragic 97.7% |
| Immigrants | Costa Rica | 3.5 /100 | #225 | Tragic 97.7% |
| Iraqis | 3.5 /100 | #226 | Tragic 97.7% |
Demographics Similar to Armenians by Nursery School
In terms of nursery school, the demographic groups most similar to Armenians are Immigrants from South America (97.6%, a difference of 0.0%), Cuban (97.6%, a difference of 0.010%), Immigrants from Ethiopia (97.6%, a difference of 0.010%), Jamaican (97.6%, a difference of 0.020%), and Fijian (97.6%, a difference of 0.020%).
| Demographics | Rating | Rank | Nursery School |
| Immigrants | Africa | 0.8 /100 | #252 | Tragic 97.6% |
| Immigrants | Iraq | 0.7 /100 | #253 | Tragic 97.6% |
| Immigrants | Congo | 0.7 /100 | #254 | Tragic 97.6% |
| Immigrants | Asia | 0.7 /100 | #255 | Tragic 97.6% |
| Yaqui | 0.6 /100 | #256 | Tragic 97.6% |
| Immigrants | Colombia | 0.6 /100 | #257 | Tragic 97.6% |
| Jamaicans | 0.6 /100 | #258 | Tragic 97.6% |
| Armenians | 0.4 /100 | #259 | Tragic 97.6% |
| Immigrants | South America | 0.4 /100 | #260 | Tragic 97.6% |
| Cubans | 0.4 /100 | #261 | Tragic 97.6% |
| Immigrants | Ethiopia | 0.4 /100 | #262 | Tragic 97.6% |
| Fijians | 0.3 /100 | #263 | Tragic 97.6% |
| Taiwanese | 0.3 /100 | #264 | Tragic 97.6% |
| Assyrians/Chaldeans/Syriacs | 0.3 /100 | #265 | Tragic 97.6% |
| Immigrants | Sierra Leone | 0.3 /100 | #266 | Tragic 97.6% |