Korean vs Armenian Seniors Poverty Over the Age of 75
COMPARE
Korean
Armenian
Seniors Poverty Over the Age of 75
Seniors Poverty Over the Age of 75 Comparison
Koreans
Armenians
11.5%
SENIORS POVERTY OVER THE AGE OF 75
94.5/ 100
METRIC RATING
87th/ 347
METRIC RANK
14.2%
SENIORS POVERTY OVER THE AGE OF 75
0.0/ 100
METRIC RATING
266th/ 347
METRIC RANK
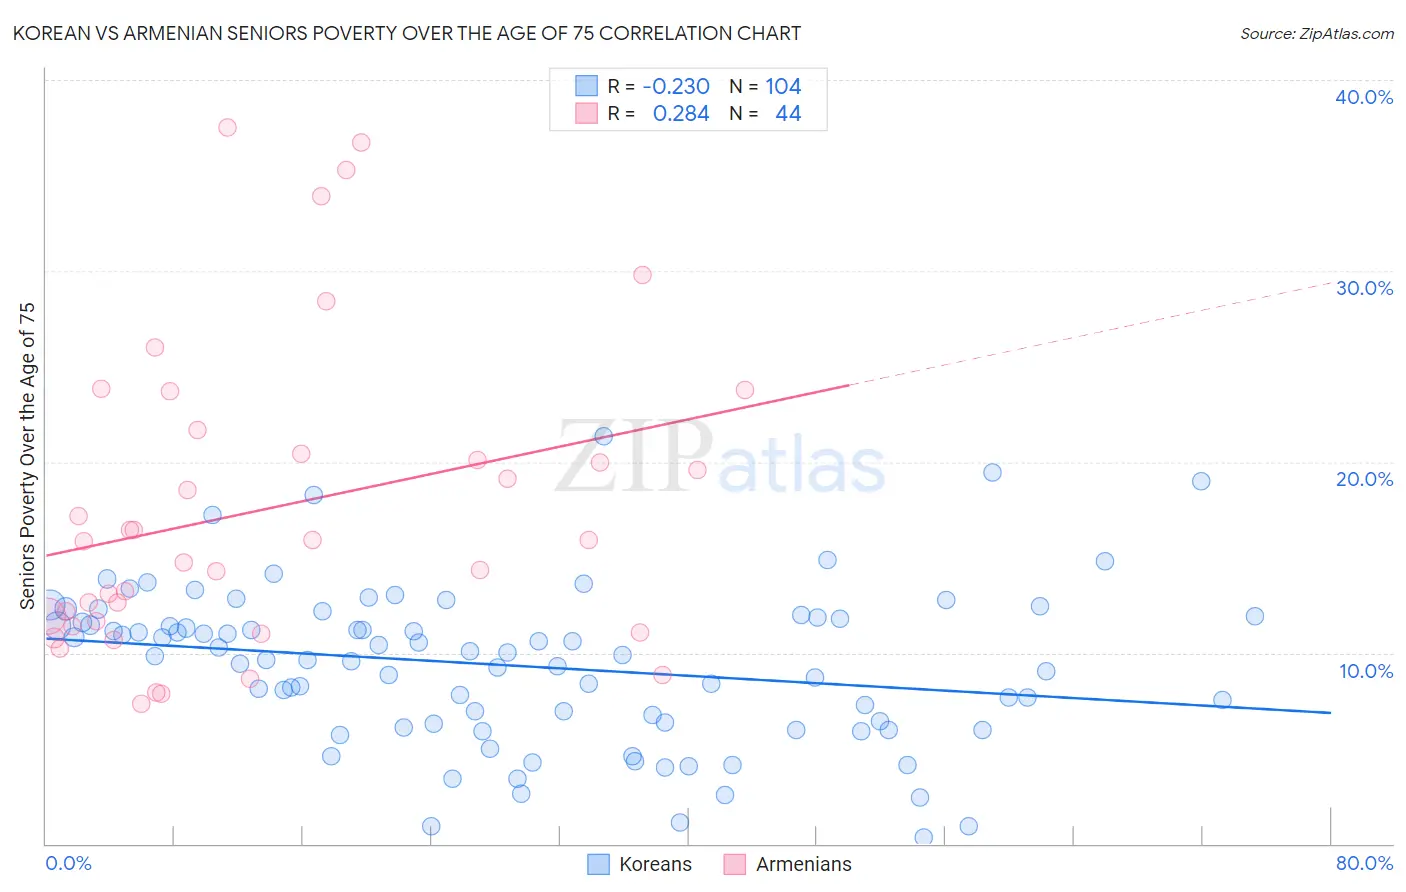
Korean vs Armenian Seniors Poverty Over the Age of 75 Correlation Chart
The statistical analysis conducted on geographies consisting of 501,136,309 people shows a weak negative correlation between the proportion of Koreans and poverty level among seniors over the age of 75 in the United States with a correlation coefficient (R) of -0.230 and weighted average of 11.5%. Similarly, the statistical analysis conducted on geographies consisting of 308,179,967 people shows a weak positive correlation between the proportion of Armenians and poverty level among seniors over the age of 75 in the United States with a correlation coefficient (R) of 0.284 and weighted average of 14.2%, a difference of 23.7%.
Seniors Poverty Over the Age of 75 Correlation Summary
| Measurement | Korean | Armenian |
| Minimum | 0.32% | 7.4% |
| Maximum | 21.3% | 37.5% |
| Range | 21.0% | 30.1% |
| Mean | 9.3% | 17.6% |
| Median | 9.9% | 15.9% |
| Interquartile 25% (IQ1) | 6.3% | 11.5% |
| Interquartile 75% (IQ3) | 11.8% | 21.1% |
| Interquartile Range (IQR) | 5.5% | 9.5% |
| Standard Deviation (Sample) | 4.1% | 8.1% |
| Standard Deviation (Population) | 4.1% | 8.0% |
Similar Demographics by Seniors Poverty Over the Age of 75
Demographics Similar to Koreans by Seniors Poverty Over the Age of 75
In terms of seniors poverty over the age of 75, the demographic groups most similar to Koreans are Immigrants from Croatia (11.5%, a difference of 0.020%), Australian (11.5%, a difference of 0.030%), Immigrants from Bulgaria (11.5%, a difference of 0.050%), Immigrants from Sri Lanka (11.5%, a difference of 0.050%), and Immigrants from South Africa (11.5%, a difference of 0.15%).
| Demographics | Rating | Rank | Seniors Poverty Over the Age of 75 |
| Alaska Natives | 95.4 /100 | #80 | Exceptional 11.4% |
| Basques | 95.1 /100 | #81 | Exceptional 11.5% |
| Iranians | 95.1 /100 | #82 | Exceptional 11.5% |
| Immigrants | South Africa | 94.9 /100 | #83 | Exceptional 11.5% |
| Immigrants | Iraq | 94.9 /100 | #84 | Exceptional 11.5% |
| Immigrants | Bulgaria | 94.7 /100 | #85 | Exceptional 11.5% |
| Australians | 94.6 /100 | #86 | Exceptional 11.5% |
| Koreans | 94.5 /100 | #87 | Exceptional 11.5% |
| Immigrants | Croatia | 94.5 /100 | #88 | Exceptional 11.5% |
| Immigrants | Sri Lanka | 94.4 /100 | #89 | Exceptional 11.5% |
| Aleuts | 94.1 /100 | #90 | Exceptional 11.5% |
| Immigrants | Germany | 94.1 /100 | #91 | Exceptional 11.5% |
| Kenyans | 93.9 /100 | #92 | Exceptional 11.5% |
| Immigrants | Poland | 92.9 /100 | #93 | Exceptional 11.6% |
| Creek | 92.7 /100 | #94 | Exceptional 11.6% |
Demographics Similar to Armenians by Seniors Poverty Over the Age of 75
In terms of seniors poverty over the age of 75, the demographic groups most similar to Armenians are Venezuelan (14.2%, a difference of 0.020%), Salvadoran (14.2%, a difference of 0.22%), Colombian (14.3%, a difference of 0.36%), South American (14.1%, a difference of 0.46%), and Immigrants from Venezuela (14.3%, a difference of 0.47%).
| Demographics | Rating | Rank | Seniors Poverty Over the Age of 75 |
| Immigrants | Portugal | 0.1 /100 | #259 | Tragic 13.9% |
| Immigrants | Immigrants | 0.1 /100 | #260 | Tragic 13.9% |
| Ghanaians | 0.1 /100 | #261 | Tragic 14.0% |
| Cajuns | 0.1 /100 | #262 | Tragic 14.0% |
| Iroquois | 0.1 /100 | #263 | Tragic 14.0% |
| South Americans | 0.0 /100 | #264 | Tragic 14.1% |
| Salvadorans | 0.0 /100 | #265 | Tragic 14.2% |
| Armenians | 0.0 /100 | #266 | Tragic 14.2% |
| Venezuelans | 0.0 /100 | #267 | Tragic 14.2% |
| Colombians | 0.0 /100 | #268 | Tragic 14.3% |
| Immigrants | Venezuela | 0.0 /100 | #269 | Tragic 14.3% |
| Immigrants | Uruguay | 0.0 /100 | #270 | Tragic 14.3% |
| Immigrants | Ghana | 0.0 /100 | #271 | Tragic 14.4% |
| Mexicans | 0.0 /100 | #272 | Tragic 14.4% |
| Immigrants | South America | 0.0 /100 | #273 | Tragic 14.4% |