Kenyan vs Immigrants from El Salvador Associate's Degree

COMPARE

Kenyan
Race
Ancestry
AfghanAfricanAlaska NativeAlaskan AthabascanAlbanianAleutAlsatianAmericanApacheArabArapahoArgentineanArmenianAssyrian/Chaldean/SyriacAustralianAustrianBahamianBangladeshiBarbadianBasqueBelgianBelizeanBermudanBhutaneseBlackfeetBolivianBrazilianBritishBritish West IndianBulgarianBurmeseCajunCambodianCanadianCape VerdeanCarpatho RusynCelticCentral AmericanCentral American IndianCherokeeCheyenneChickasawChileanChineseChippewaChoctawColombianColvilleComancheCosta RicanCreeCreekCroatianCrowCubanCypriotCzechCzechoslovakianDanishDelawareDominicanDutchDutch West IndianEastern EuropeanEcuadorianEgyptianEnglishEstonianEthiopianEuropeanFijianFilipinoFinnishFrenchFrench American IndianFrench CanadianGermanGerman RussianGhanaianGreekGuamanian/ChamorroGuatemalanGuyaneseHaitianHmongHonduranHopiHoumaHungarianIcelanderIndian (Asian)IndonesianInupiatIranianIraqiIrishIroquoisIsraeliItalianJamaicanJapaneseJordanianKenyanKiowaKoreanLaotianLatvianLebaneseLiberianLithuanianLumbeeLuxembourgerMacedonianMalaysianMalteseMarshalleseMenomineeMexicanMexican American IndianMongolianMoroccanNative HawaiianNavajoNepaleseNew ZealanderNicaraguanNigerianNorthern EuropeanNorwegianOkinawanOsageOttawaPaiutePakistaniPalestinianPanamanianParaguayanPennsylvania GermanPeruvianPimaPolishPortuguesePotawatomiPuebloPuerto RicanPuget Sound SalishRomanianRussianSalvadoranSamoanScandinavianScotch-IrishScottishSeminoleSenegaleseSerbianShoshoneSierra LeoneanSiouxSlavicSlovakSloveneSomaliSouth AfricanSouth AmericanSouth American IndianSoviet UnionSpaniardSpanishSpanish AmericanSpanish American IndianSri LankanSubsaharan AfricanSudaneseSwedishSwissSyrianTaiwaneseThaiTlingit-HaidaTohono O'OdhamTonganTrinidadian and TobagonianTsimshianTurkishU.S. Virgin IslanderUgandanUkrainianUruguayanUteVenezuelanVietnameseWelshWest IndianYakamaYaquiYugoslavianYumanYup'ikZimbabwean
Immigration
NonimmigrantsImmigrantsAfghanistanAfricaAlbaniaArgentinaArmeniaAsiaAustraliaAustriaBahamasBangladeshBarbadosBelarusBelgiumBelizeBoliviaBosnia and HerzegovinaBrazilBulgariaBurma/MyanmarCabo VerdeCambodiaCameroonCanadaCaribbeanCentral AmericaChileChinaColombiaCongoCosta RicaCroatiaCubaCzechoslovakiaDenmarkDominicaDominican RepublicEastern AfricaEastern AsiaEastern EuropeEcuadorEgyptEnglandEritreaEthiopiaEuropeFijiFranceGermanyGhanaGreeceGrenadaGuatemalaGuyanaHaitiHondurasHong KongHungaryIndiaIndonesiaIranIraqIrelandIsraelItalyJamaicaJapanJordanKazakhstanKenyaKoreaKuwaitLaosLatin AmericaLatviaLebanonLiberiaLithuaniaMalaysiaMexicoMicronesiaMiddle AfricaMoldovaMoroccoNepalNetherlandsNicaraguaNigeriaNorth AmericaNorth MacedoniaNorthern AfricaNorthern EuropeNorwayOceaniaPakistanPanamaPeruPhilippinesPolandPortugalRomaniaRussiaSaudi ArabiaScotlandSenegalSerbiaSierra LeoneSingaporeSomaliaSouth AfricaSouth AmericaSouth Central AsiaSouth Eastern AsiaSouthern EuropeSpainSri LankaSt. Vincent and the GrenadinesSudanSwedenSwitzerlandSyriaTaiwanThailandTrinidad and TobagoTurkeyUgandaUkraineUruguayUzbekistanVenezuelaVietnamWest IndiesWestern AfricaWestern AsiaWestern EuropeYemenZaireZimbabweAzores
Immigrants from El Salvador
Race
Ancestry
AfghanAfricanAlaska NativeAlaskan AthabascanAlbanianAleutAlsatianAmericanApacheArabArapahoArgentineanArmenianAssyrian/Chaldean/SyriacAustralianAustrianBahamianBangladeshiBarbadianBasqueBelgianBelizeanBermudanBhutaneseBlackfeetBolivianBrazilianBritishBritish West IndianBulgarianBurmeseCajunCambodianCanadianCape VerdeanCarpatho RusynCelticCentral AmericanCentral American IndianCherokeeCheyenneChickasawChileanChineseChippewaChoctawColombianColvilleComancheCosta RicanCreeCreekCroatianCrowCubanCypriotCzechCzechoslovakianDanishDelawareDominicanDutchDutch West IndianEastern EuropeanEcuadorianEgyptianEnglishEstonianEthiopianEuropeanFijianFilipinoFinnishFrenchFrench American IndianFrench CanadianGermanGerman RussianGhanaianGreekGuamanian/ChamorroGuatemalanGuyaneseHaitianHmongHonduranHopiHoumaHungarianIcelanderIndian (Asian)IndonesianInupiatIranianIraqiIrishIroquoisIsraeliItalianJamaicanJapaneseJordanianKiowaKoreanLaotianLatvianLebaneseLiberianLithuanianLumbeeLuxembourgerMacedonianMalaysianMalteseMarshalleseMenomineeMexicanMexican American IndianMongolianMoroccanNative HawaiianNavajoNepaleseNew ZealanderNicaraguanNigerianNorthern EuropeanNorwegianOkinawanOsageOttawaPaiutePakistaniPalestinianPanamanianParaguayanPennsylvania GermanPeruvianPimaPolishPortuguesePotawatomiPuebloPuerto RicanPuget Sound SalishRomanianRussianSalvadoranSamoanScandinavianScotch-IrishScottishSeminoleSenegaleseSerbianShoshoneSierra LeoneanSiouxSlavicSlovakSloveneSomaliSouth AfricanSouth AmericanSouth American IndianSoviet UnionSpaniardSpanishSpanish AmericanSpanish American IndianSri LankanSubsaharan AfricanSudaneseSwedishSwissSyrianTaiwaneseThaiTlingit-HaidaTohono O'OdhamTonganTrinidadian and TobagonianTsimshianTurkishU.S. Virgin IslanderUgandanUkrainianUruguayanUteVenezuelanVietnameseWelshWest IndianYakamaYaquiYugoslavianYumanYup'ikZimbabwean
Immigration
NonimmigrantsImmigrantsAfghanistanAfricaAlbaniaArgentinaArmeniaAsiaAustraliaAustriaBahamasBangladeshBarbadosBelarusBelgiumBelizeBoliviaBosnia and HerzegovinaBrazilBulgariaBurma/MyanmarCabo VerdeCambodiaCameroonCanadaCaribbeanCentral AmericaChileChinaColombiaCongoCosta RicaCroatiaCubaCzechoslovakiaDenmarkDominicaDominican RepublicEastern AfricaEastern AsiaEastern EuropeEcuadorEgyptEl SalvadorEnglandEritreaEthiopiaEuropeFijiFranceGermanyGhanaGreeceGrenadaGuatemalaGuyanaHaitiHondurasHong KongHungaryIndiaIndonesiaIranIraqIrelandIsraelItalyJamaicaJapanJordanKazakhstanKenyaKoreaKuwaitLaosLatin AmericaLatviaLebanonLiberiaLithuaniaMalaysiaMexicoMicronesiaMiddle AfricaMoldovaMoroccoNepalNetherlandsNicaraguaNigeriaNorth AmericaNorth MacedoniaNorthern AfricaNorthern EuropeNorwayOceaniaPakistanPanamaPeruPhilippinesPolandPortugalRomaniaRussiaSaudi ArabiaScotlandSenegalSerbiaSierra LeoneSingaporeSomaliaSouth AfricaSouth AmericaSouth Central AsiaSouth Eastern AsiaSouthern EuropeSpainSri LankaSt. Vincent and the GrenadinesSudanSwedenSwitzerlandSyriaTaiwanThailandTrinidad and TobagoTurkeyUgandaUkraineUruguayUzbekistanVenezuelaVietnamWest IndiesWestern AfricaWestern AsiaWestern EuropeYemenZaireZimbabweAzores
Associate's Degree
Income
Poverty
Unemployment
Labor Participation
Family Structure
Vehicle Availability
Education Level
Disability

Associate's Degree Comparison

Kenyans

Immigrants from El Salvador

Good
Tragic
47.1%
ASSOCIATE'S DEGREE
70.6/ 100
METRIC RATING
155th/ 347
METRIC RANK
38.4%
ASSOCIATE'S DEGREE
0.0/ 100
METRIC RATING
307th/ 347
METRIC RANK

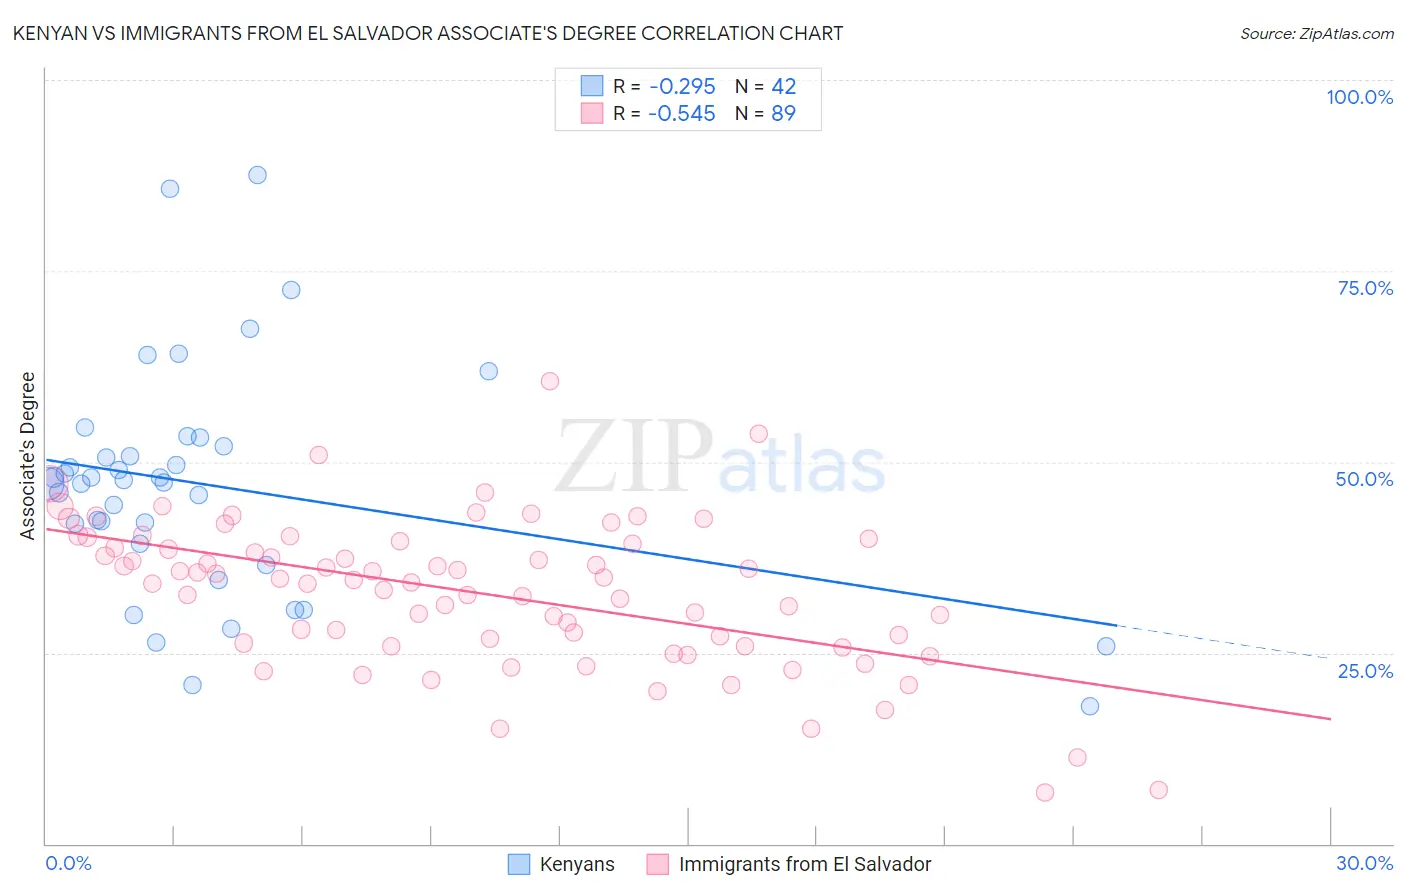
Kenyan vs Immigrants from El Salvador Associate's Degree Correlation Chart

The statistical analysis conducted on geographies consisting of 168,244,481 people shows a weak negative correlation between the proportion of Kenyans and percentage of population with at least associate's degree education in the United States with a correlation coefficient (R) of -0.295 and weighted average of 47.1%. Similarly, the statistical analysis conducted on geographies consisting of 357,840,012 people shows a substantial negative correlation between the proportion of Immigrants from El Salvador and percentage of population with at least associate's degree education in the United States with a correlation coefficient (R) of -0.545 and weighted average of 38.4%, a difference of 22.7%.
Kenyan vs Immigrants from El Salvador Associate's Degree

Associate's Degree Correlation Summary

MeasurementKenyanImmigrants from El Salvador
Minimum18.0%6.6%
Maximum87.6%60.5%
Range69.6%53.9%
Mean47.0%32.9%
Median47.5%34.5%
Interquartile 25% (IQ1)39.3%26.1%
Interquartile 75% (IQ3)52.1%39.4%
Interquartile Range (IQR)12.8%13.3%
Standard Deviation (Sample)15.0%9.6%
Standard Deviation (Population)14.8%9.6%

Similar Demographics by Associate's Degree

Demographics Similar to Kenyans by Associate's Degree

In terms of associate's degree, the demographic groups most similar to Kenyans are South American (47.1%, a difference of 0.010%), Sudanese (47.1%, a difference of 0.030%), Immigrants from Germany (47.1%, a difference of 0.080%), Immigrants from Kenya (47.2%, a difference of 0.13%), and Immigrants from Poland (47.1%, a difference of 0.13%).
DemographicsRating | RankAssociate's Degree
South American Indians
76.7
/100
|
#148
Good
47.4%
Immigrants | Armenia
76.6
/100
|
#149
Good
47.4%
Iraqis
76.2
/100
|
#150
Good
47.4%
Immigrants | North Macedonia
76.0
/100
|
#151
Good
47.4%
Immigrants | Afghanistan
74.3
/100
|
#152
Good
47.3%
Czechs
72.2
/100
|
#153
Good
47.2%
Immigrants | Kenya
72.1
/100
|
#154
Good
47.2%
Kenyans
70.6
/100
|
#155
Good
47.1%
South Americans
70.5
/100
|
#156
Good
47.1%
Sudanese
70.3
/100
|
#157
Good
47.1%
Immigrants | Germany
69.7
/100
|
#158
Good
47.1%
Immigrants | Poland
69.2
/100
|
#159
Good
47.1%
Scottish
65.4
/100
|
#160
Good
46.9%
Scandinavians
65.2
/100
|
#161
Good
46.9%
Immigrants | Africa
63.2
/100
|
#162
Good
46.8%

Demographics Similar to Immigrants from El Salvador by Associate's Degree

In terms of associate's degree, the demographic groups most similar to Immigrants from El Salvador are Shoshone (38.4%, a difference of 0.040%), Immigrants from Honduras (38.5%, a difference of 0.11%), Sioux (38.5%, a difference of 0.17%), Guatemalan (38.5%, a difference of 0.23%), and Colville (38.5%, a difference of 0.31%).
DemographicsRating | RankAssociate's Degree
Chickasaw
0.0
/100
|
#300
Tragic
38.6%
Tsimshian
0.0
/100
|
#301
Tragic
38.6%
Colville
0.0
/100
|
#302
Tragic
38.5%
Guatemalans
0.0
/100
|
#303
Tragic
38.5%
Sioux
0.0
/100
|
#304
Tragic
38.5%
Immigrants | Honduras
0.0
/100
|
#305
Tragic
38.5%
Shoshone
0.0
/100
|
#306
Tragic
38.4%
Immigrants | El Salvador
0.0
/100
|
#307
Tragic
38.4%
Mexican American Indians
0.0
/100
|
#308
Tragic
38.2%
Immigrants | Guatemala
0.0
/100
|
#309
Tragic
38.1%
Immigrants | Dominican Republic
0.0
/100
|
#310
Tragic
37.9%
Immigrants | Latin America
0.0
/100
|
#311
Tragic
37.9%
Choctaw
0.0
/100
|
#312
Tragic
37.8%
Hispanics or Latinos
0.0
/100
|
#313
Tragic
37.7%
Seminole
0.0
/100
|
#314
Tragic
37.7%