Kenyan vs Guyanese Associate's Degree
COMPARE
Kenyan
Guyanese
Associate's Degree
Associate's Degree Comparison
Kenyans
Guyanese
47.1%
ASSOCIATE'S DEGREE
70.6/ 100
METRIC RATING
155th/ 347
METRIC RANK
42.3%
ASSOCIATE'S DEGREE
1.0/ 100
METRIC RATING
243rd/ 347
METRIC RANK
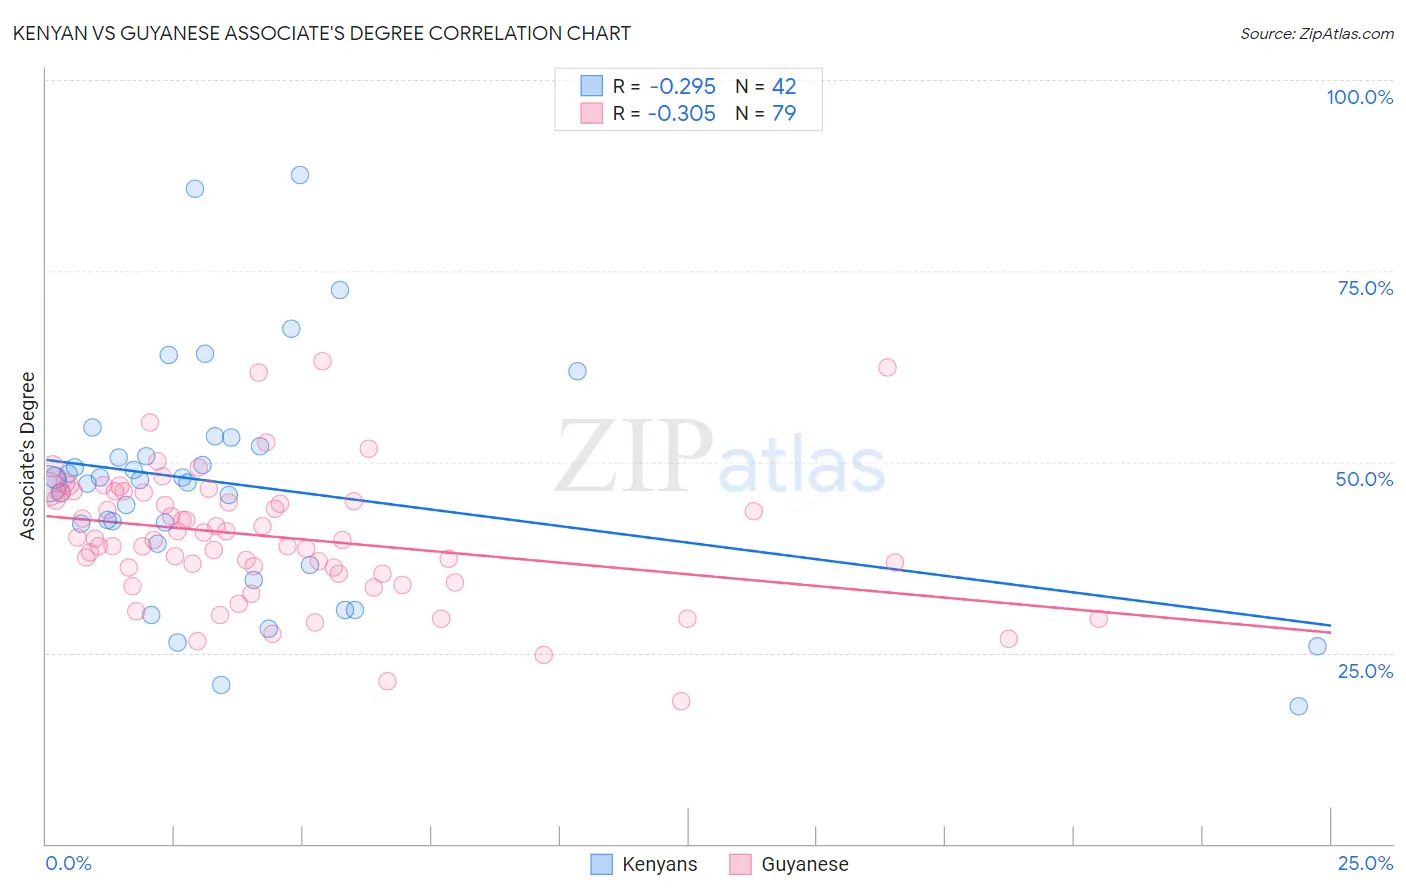
Kenyan vs Guyanese Associate's Degree Correlation Chart
The statistical analysis conducted on geographies consisting of 168,244,481 people shows a weak negative correlation between the proportion of Kenyans and percentage of population with at least associate's degree education in the United States with a correlation coefficient (R) of -0.295 and weighted average of 47.1%. Similarly, the statistical analysis conducted on geographies consisting of 176,923,835 people shows a mild negative correlation between the proportion of Guyanese and percentage of population with at least associate's degree education in the United States with a correlation coefficient (R) of -0.305 and weighted average of 42.3%, a difference of 11.3%.
Associate's Degree Correlation Summary
| Measurement | Kenyan | Guyanese |
| Minimum | 18.0% | 18.6% |
| Maximum | 87.6% | 63.1% |
| Range | 69.6% | 44.5% |
| Mean | 47.0% | 40.2% |
| Median | 47.5% | 39.9% |
| Interquartile 25% (IQ1) | 39.3% | 35.4% |
| Interquartile 75% (IQ3) | 52.1% | 46.0% |
| Interquartile Range (IQR) | 12.8% | 10.6% |
| Standard Deviation (Sample) | 15.0% | 8.5% |
| Standard Deviation (Population) | 14.8% | 8.5% |
Similar Demographics by Associate's Degree
Demographics Similar to Kenyans by Associate's Degree
In terms of associate's degree, the demographic groups most similar to Kenyans are South American (47.1%, a difference of 0.010%), Sudanese (47.1%, a difference of 0.030%), Immigrants from Germany (47.1%, a difference of 0.080%), Immigrants from Kenya (47.2%, a difference of 0.13%), and Immigrants from Poland (47.1%, a difference of 0.13%).
| Demographics | Rating | Rank | Associate's Degree |
| South American Indians | 76.7 /100 | #148 | Good 47.4% |
| Immigrants | Armenia | 76.6 /100 | #149 | Good 47.4% |
| Iraqis | 76.2 /100 | #150 | Good 47.4% |
| Immigrants | North Macedonia | 76.0 /100 | #151 | Good 47.4% |
| Immigrants | Afghanistan | 74.3 /100 | #152 | Good 47.3% |
| Czechs | 72.2 /100 | #153 | Good 47.2% |
| Immigrants | Kenya | 72.1 /100 | #154 | Good 47.2% |
| Kenyans | 70.6 /100 | #155 | Good 47.1% |
| South Americans | 70.5 /100 | #156 | Good 47.1% |
| Sudanese | 70.3 /100 | #157 | Good 47.1% |
| Immigrants | Germany | 69.7 /100 | #158 | Good 47.1% |
| Immigrants | Poland | 69.2 /100 | #159 | Good 47.1% |
| Scottish | 65.4 /100 | #160 | Good 46.9% |
| Scandinavians | 65.2 /100 | #161 | Good 46.9% |
| Immigrants | Africa | 63.2 /100 | #162 | Good 46.8% |
Demographics Similar to Guyanese by Associate's Degree
In terms of associate's degree, the demographic groups most similar to Guyanese are Immigrants from West Indies (42.4%, a difference of 0.11%), British West Indian (42.4%, a difference of 0.12%), Immigrants from Liberia (42.3%, a difference of 0.14%), Immigrants from Cambodia (42.3%, a difference of 0.16%), and Delaware (42.3%, a difference of 0.19%).
| Demographics | Rating | Rank | Associate's Degree |
| Immigrants | St. Vincent and the Grenadines | 1.9 /100 | #236 | Tragic 42.9% |
| Immigrants | Nonimmigrants | 1.9 /100 | #237 | Tragic 42.9% |
| Iroquois | 1.7 /100 | #238 | Tragic 42.8% |
| Immigrants | Grenada | 1.3 /100 | #239 | Tragic 42.6% |
| Cree | 1.2 /100 | #240 | Tragic 42.5% |
| British West Indians | 1.0 /100 | #241 | Tragic 42.4% |
| Immigrants | West Indies | 1.0 /100 | #242 | Tragic 42.4% |
| Guyanese | 1.0 /100 | #243 | Tragic 42.3% |
| Immigrants | Liberia | 0.9 /100 | #244 | Tragic 42.3% |
| Immigrants | Cambodia | 0.9 /100 | #245 | Tragic 42.3% |
| Delaware | 0.9 /100 | #246 | Tragic 42.3% |
| Immigrants | Fiji | 0.8 /100 | #247 | Tragic 42.2% |
| Immigrants | Ecuador | 0.8 /100 | #248 | Tragic 42.2% |
| Jamaicans | 0.7 /100 | #249 | Tragic 42.1% |
| U.S. Virgin Islanders | 0.7 /100 | #250 | Tragic 42.1% |