Kenyan vs Marshallese 8th Grade
COMPARE
Kenyan
Marshallese
8th Grade
8th Grade Comparison
Kenyans
Marshallese
95.9%
8TH GRADE
74.5/ 100
METRIC RATING
155th/ 347
METRIC RANK
95.7%
8TH GRADE
47.6/ 100
METRIC RATING
177th/ 347
METRIC RANK
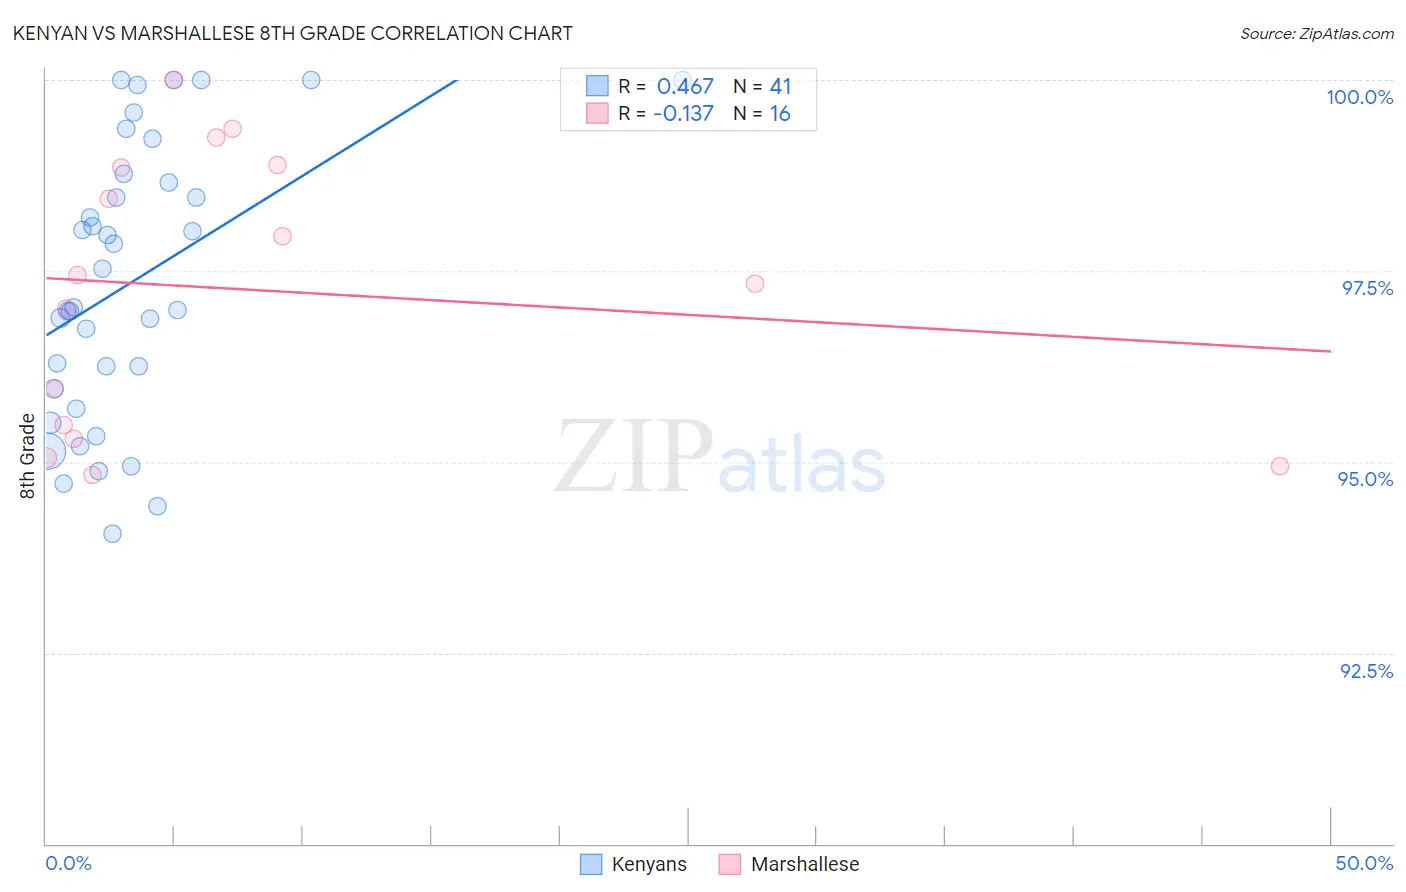
Kenyan vs Marshallese 8th Grade Correlation Chart
The statistical analysis conducted on geographies consisting of 168,244,042 people shows a moderate positive correlation between the proportion of Kenyans and percentage of population with at least 8th grade education in the United States with a correlation coefficient (R) of 0.467 and weighted average of 95.9%. Similarly, the statistical analysis conducted on geographies consisting of 14,761,315 people shows a poor negative correlation between the proportion of Marshallese and percentage of population with at least 8th grade education in the United States with a correlation coefficient (R) of -0.137 and weighted average of 95.7%, a difference of 0.19%.
8th Grade Correlation Summary
| Measurement | Kenyan | Marshallese |
| Minimum | 94.1% | 94.8% |
| Maximum | 100.0% | 100.0% |
| Range | 5.9% | 5.2% |
| Mean | 97.3% | 97.3% |
| Median | 97.0% | 97.4% |
| Interquartile 25% (IQ1) | 95.8% | 95.4% |
| Interquartile 75% (IQ3) | 98.7% | 98.9% |
| Interquartile Range (IQR) | 2.9% | 3.5% |
| Standard Deviation (Sample) | 1.8% | 1.8% |
| Standard Deviation (Population) | 1.8% | 1.7% |
Similar Demographics by 8th Grade
Demographics Similar to Kenyans by 8th Grade
In terms of 8th grade, the demographic groups most similar to Kenyans are Ugandan (95.9%, a difference of 0.0%), Immigrants from Taiwan (95.9%, a difference of 0.030%), Hopi (95.9%, a difference of 0.040%), Arab (95.9%, a difference of 0.040%), and Immigrants from Jordan (95.9%, a difference of 0.050%).
| Demographics | Rating | Rank | 8th Grade |
| Albanians | 83.1 /100 | #148 | Excellent 96.0% |
| Immigrants | Israel | 81.3 /100 | #149 | Excellent 96.0% |
| Immigrants | Russia | 80.9 /100 | #150 | Excellent 96.0% |
| Blackfeet | 80.8 /100 | #151 | Excellent 96.0% |
| French American Indians | 80.6 /100 | #152 | Excellent 96.0% |
| Immigrants | Jordan | 79.5 /100 | #153 | Good 95.9% |
| Hopi | 79.4 /100 | #154 | Good 95.9% |
| Kenyans | 74.5 /100 | #155 | Good 95.9% |
| Ugandans | 74.1 /100 | #156 | Good 95.9% |
| Immigrants | Taiwan | 70.5 /100 | #157 | Good 95.9% |
| Arabs | 69.4 /100 | #158 | Good 95.9% |
| Immigrants | Kazakhstan | 68.4 /100 | #159 | Good 95.9% |
| Seminole | 67.7 /100 | #160 | Good 95.8% |
| Bermudans | 67.5 /100 | #161 | Good 95.8% |
| Immigrants | Kenya | 67.2 /100 | #162 | Good 95.8% |
Demographics Similar to Marshallese by 8th Grade
In terms of 8th grade, the demographic groups most similar to Marshallese are Venezuelan (95.7%, a difference of 0.0%), Immigrants from Albania (95.7%, a difference of 0.010%), Pakistani (95.7%, a difference of 0.010%), Immigrants from Brazil (95.7%, a difference of 0.010%), and Chilean (95.7%, a difference of 0.020%).
| Demographics | Rating | Rank | 8th Grade |
| Ute | 58.5 /100 | #170 | Average 95.8% |
| Egyptians | 58.2 /100 | #171 | Average 95.8% |
| Immigrants | Korea | 57.9 /100 | #172 | Average 95.8% |
| Mongolians | 53.0 /100 | #173 | Average 95.8% |
| Chileans | 50.0 /100 | #174 | Average 95.7% |
| Immigrants | Albania | 49.6 /100 | #175 | Average 95.7% |
| Pakistanis | 48.8 /100 | #176 | Average 95.7% |
| Marshallese | 47.6 /100 | #177 | Average 95.7% |
| Venezuelans | 47.5 /100 | #178 | Average 95.7% |
| Immigrants | Brazil | 45.4 /100 | #179 | Average 95.7% |
| Iraqis | 40.5 /100 | #180 | Average 95.7% |
| Immigrants | Spain | 38.7 /100 | #181 | Fair 95.7% |
| Immigrants | Egypt | 37.9 /100 | #182 | Fair 95.7% |
| Immigrants | Iraq | 36.2 /100 | #183 | Fair 95.6% |
| Immigrants | Uganda | 36.0 /100 | #184 | Fair 95.6% |