Kenyan vs Australian 8th Grade
COMPARE
Kenyan
Australian
8th Grade
8th Grade Comparison
Kenyans
Australians
95.9%
8TH GRADE
74.5/ 100
METRIC RATING
155th/ 347
METRIC RANK
96.7%
8TH GRADE
99.8/ 100
METRIC RATING
56th/ 347
METRIC RANK
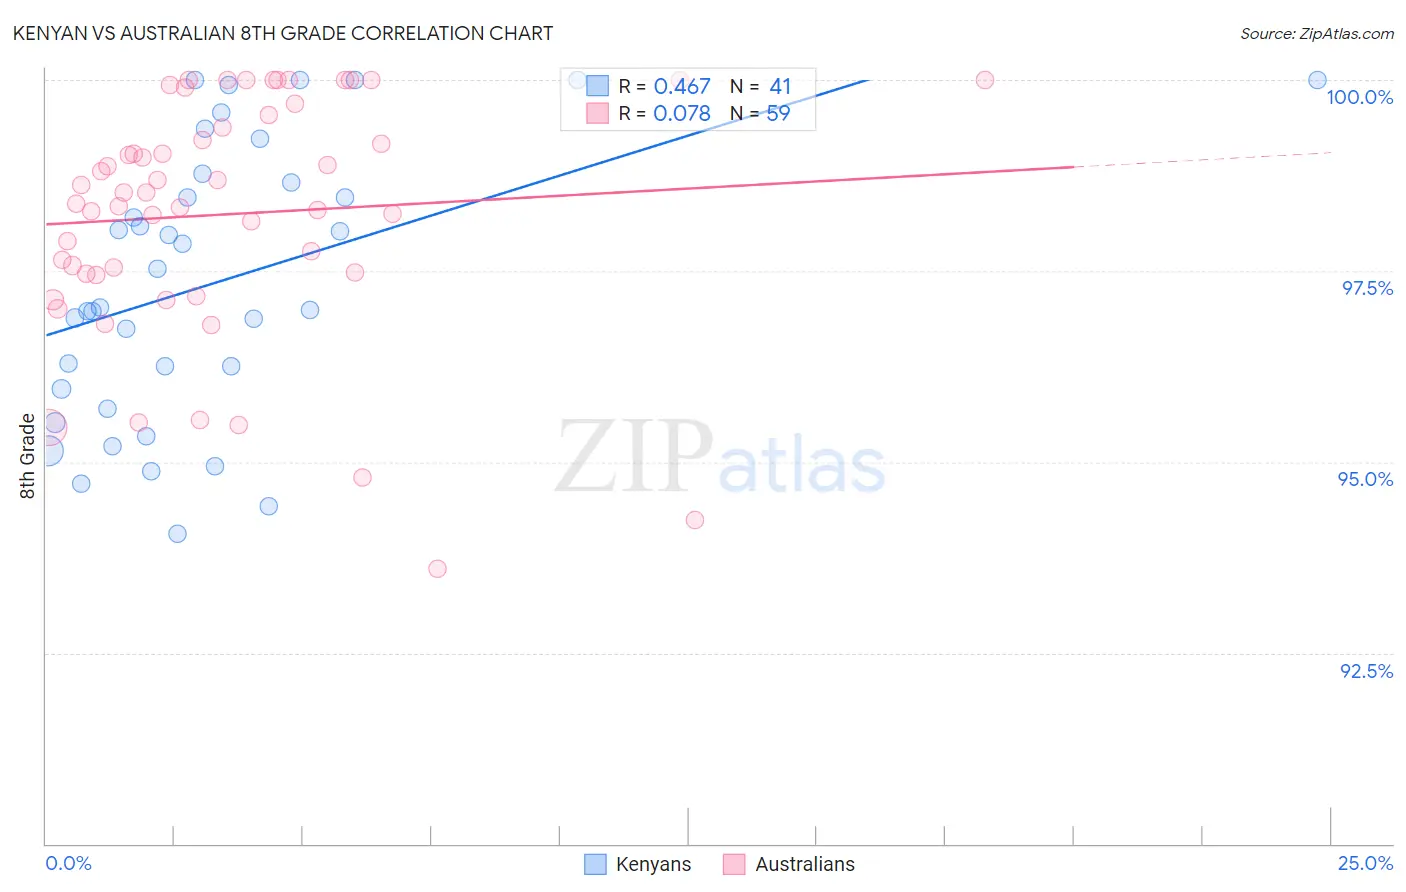
Kenyan vs Australian 8th Grade Correlation Chart
The statistical analysis conducted on geographies consisting of 168,244,042 people shows a moderate positive correlation between the proportion of Kenyans and percentage of population with at least 8th grade education in the United States with a correlation coefficient (R) of 0.467 and weighted average of 95.9%. Similarly, the statistical analysis conducted on geographies consisting of 224,153,693 people shows a slight positive correlation between the proportion of Australians and percentage of population with at least 8th grade education in the United States with a correlation coefficient (R) of 0.078 and weighted average of 96.7%, a difference of 0.87%.
8th Grade Correlation Summary
| Measurement | Kenyan | Australian |
| Minimum | 94.1% | 93.6% |
| Maximum | 100.0% | 100.0% |
| Range | 5.9% | 6.4% |
| Mean | 97.3% | 98.2% |
| Median | 97.0% | 98.5% |
| Interquartile 25% (IQ1) | 95.8% | 97.5% |
| Interquartile 75% (IQ3) | 98.7% | 99.5% |
| Interquartile Range (IQR) | 2.9% | 2.1% |
| Standard Deviation (Sample) | 1.8% | 1.6% |
| Standard Deviation (Population) | 1.8% | 1.6% |
Similar Demographics by 8th Grade
Demographics Similar to Kenyans by 8th Grade
In terms of 8th grade, the demographic groups most similar to Kenyans are Ugandan (95.9%, a difference of 0.0%), Immigrants from Taiwan (95.9%, a difference of 0.030%), Hopi (95.9%, a difference of 0.040%), Arab (95.9%, a difference of 0.040%), and Immigrants from Jordan (95.9%, a difference of 0.050%).
| Demographics | Rating | Rank | 8th Grade |
| Albanians | 83.1 /100 | #148 | Excellent 96.0% |
| Immigrants | Israel | 81.3 /100 | #149 | Excellent 96.0% |
| Immigrants | Russia | 80.9 /100 | #150 | Excellent 96.0% |
| Blackfeet | 80.8 /100 | #151 | Excellent 96.0% |
| French American Indians | 80.6 /100 | #152 | Excellent 96.0% |
| Immigrants | Jordan | 79.5 /100 | #153 | Good 95.9% |
| Hopi | 79.4 /100 | #154 | Good 95.9% |
| Kenyans | 74.5 /100 | #155 | Good 95.9% |
| Ugandans | 74.1 /100 | #156 | Good 95.9% |
| Immigrants | Taiwan | 70.5 /100 | #157 | Good 95.9% |
| Arabs | 69.4 /100 | #158 | Good 95.9% |
| Immigrants | Kazakhstan | 68.4 /100 | #159 | Good 95.9% |
| Seminole | 67.7 /100 | #160 | Good 95.8% |
| Bermudans | 67.5 /100 | #161 | Good 95.8% |
| Immigrants | Kenya | 67.2 /100 | #162 | Good 95.8% |
Demographics Similar to Australians by 8th Grade
In terms of 8th grade, the demographic groups most similar to Australians are Serbian (96.7%, a difference of 0.0%), Russian (96.7%, a difference of 0.0%), Macedonian (96.7%, a difference of 0.0%), Austrian (96.7%, a difference of 0.010%), and Greek (96.8%, a difference of 0.030%).
| Demographics | Rating | Rank | 8th Grade |
| Estonians | 99.9 /100 | #49 | Exceptional 96.8% |
| Immigrants | Scotland | 99.9 /100 | #50 | Exceptional 96.8% |
| Celtics | 99.9 /100 | #51 | Exceptional 96.8% |
| Greeks | 99.9 /100 | #52 | Exceptional 96.8% |
| Austrians | 99.9 /100 | #53 | Exceptional 96.7% |
| Serbians | 99.8 /100 | #54 | Exceptional 96.7% |
| Russians | 99.8 /100 | #55 | Exceptional 96.7% |
| Australians | 99.8 /100 | #56 | Exceptional 96.7% |
| Macedonians | 99.8 /100 | #57 | Exceptional 96.7% |
| Immigrants | Canada | 99.8 /100 | #58 | Exceptional 96.7% |
| Immigrants | North America | 99.8 /100 | #59 | Exceptional 96.7% |
| Immigrants | Northern Europe | 99.8 /100 | #60 | Exceptional 96.7% |
| Immigrants | Austria | 99.8 /100 | #61 | Exceptional 96.7% |
| Whites/Caucasians | 99.8 /100 | #62 | Exceptional 96.7% |
| Ukrainians | 99.7 /100 | #63 | Exceptional 96.7% |