Palestinian vs Immigrants from Grenada 8th Grade
COMPARE
Palestinian
Immigrants from Grenada
8th Grade
8th Grade Comparison
Palestinians
Immigrants from Grenada
96.2%
8TH GRADE
94.6/ 100
METRIC RATING
124th/ 347
METRIC RANK
94.3%
8TH GRADE
0.0/ 100
METRIC RATING
291st/ 347
METRIC RANK
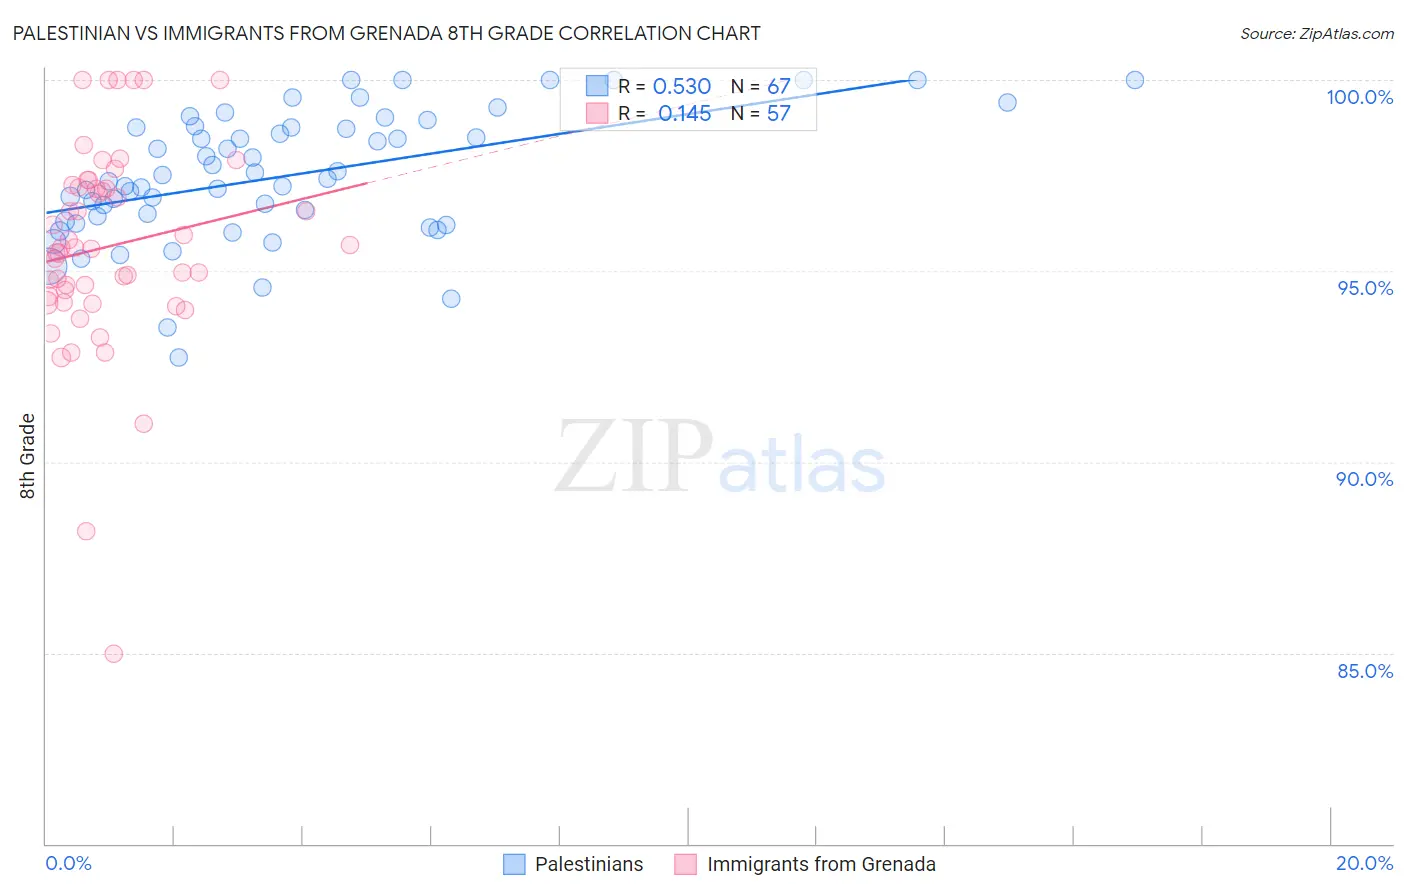
Palestinian vs Immigrants from Grenada 8th Grade Correlation Chart
The statistical analysis conducted on geographies consisting of 216,424,519 people shows a substantial positive correlation between the proportion of Palestinians and percentage of population with at least 8th grade education in the United States with a correlation coefficient (R) of 0.530 and weighted average of 96.2%. Similarly, the statistical analysis conducted on geographies consisting of 67,192,275 people shows a poor positive correlation between the proportion of Immigrants from Grenada and percentage of population with at least 8th grade education in the United States with a correlation coefficient (R) of 0.145 and weighted average of 94.3%, a difference of 2.0%.
8th Grade Correlation Summary
| Measurement | Palestinian | Immigrants from Grenada |
| Minimum | 92.7% | 85.0% |
| Maximum | 100.0% | 100.0% |
| Range | 7.3% | 15.0% |
| Mean | 97.5% | 95.6% |
| Median | 97.4% | 95.6% |
| Interquartile 25% (IQ1) | 96.3% | 94.3% |
| Interquartile 75% (IQ3) | 98.8% | 97.2% |
| Interquartile Range (IQR) | 2.5% | 3.0% |
| Standard Deviation (Sample) | 1.7% | 2.7% |
| Standard Deviation (Population) | 1.7% | 2.7% |
Similar Demographics by 8th Grade
Demographics Similar to Palestinians by 8th Grade
In terms of 8th grade, the demographic groups most similar to Palestinians are Filipino (96.2%, a difference of 0.0%), Immigrants from Romania (96.2%, a difference of 0.010%), Immigrants from Switzerland (96.2%, a difference of 0.020%), Immigrants from France (96.2%, a difference of 0.020%), and Immigrants from Bulgaria (96.2%, a difference of 0.020%).
| Demographics | Rating | Rank | 8th Grade |
| Immigrants | Croatia | 96.0 /100 | #117 | Exceptional 96.2% |
| Immigrants | Norway | 95.7 /100 | #118 | Exceptional 96.2% |
| Immigrants | Switzerland | 95.3 /100 | #119 | Exceptional 96.2% |
| Immigrants | France | 95.3 /100 | #120 | Exceptional 96.2% |
| Immigrants | Bulgaria | 95.3 /100 | #121 | Exceptional 96.2% |
| Immigrants | Europe | 95.3 /100 | #122 | Exceptional 96.2% |
| Filipinos | 94.6 /100 | #123 | Exceptional 96.2% |
| Palestinians | 94.6 /100 | #124 | Exceptional 96.2% |
| Immigrants | Romania | 94.1 /100 | #125 | Exceptional 96.2% |
| Choctaw | 94.0 /100 | #126 | Exceptional 96.2% |
| Immigrants | Serbia | 94.0 /100 | #127 | Exceptional 96.2% |
| Immigrants | Bosnia and Herzegovina | 93.9 /100 | #128 | Exceptional 96.2% |
| Cheyenne | 93.3 /100 | #129 | Exceptional 96.1% |
| Soviet Union | 92.6 /100 | #130 | Exceptional 96.1% |
| Pueblo | 92.3 /100 | #131 | Exceptional 96.1% |
Demographics Similar to Immigrants from Grenada by 8th Grade
In terms of 8th grade, the demographic groups most similar to Immigrants from Grenada are Immigrants from West Indies (94.3%, a difference of 0.010%), Bangladeshi (94.3%, a difference of 0.070%), British West Indian (94.4%, a difference of 0.080%), Yaqui (94.2%, a difference of 0.10%), and Houma (94.2%, a difference of 0.10%).
| Demographics | Rating | Rank | 8th Grade |
| Immigrants | Philippines | 0.1 /100 | #284 | Tragic 94.6% |
| Immigrants | Barbados | 0.0 /100 | #285 | Tragic 94.5% |
| Immigrants | Peru | 0.0 /100 | #286 | Tragic 94.5% |
| Tohono O'odham | 0.0 /100 | #287 | Tragic 94.5% |
| Malaysians | 0.0 /100 | #288 | Tragic 94.5% |
| British West Indians | 0.0 /100 | #289 | Tragic 94.4% |
| Immigrants | West Indies | 0.0 /100 | #290 | Tragic 94.3% |
| Immigrants | Grenada | 0.0 /100 | #291 | Tragic 94.3% |
| Bangladeshis | 0.0 /100 | #292 | Tragic 94.3% |
| Yaqui | 0.0 /100 | #293 | Tragic 94.2% |
| Houma | 0.0 /100 | #294 | Tragic 94.2% |
| Fijians | 0.0 /100 | #295 | Tragic 94.2% |
| Haitians | 0.0 /100 | #296 | Tragic 94.2% |
| Immigrants | South Eastern Asia | 0.0 /100 | #297 | Tragic 94.2% |
| Indonesians | 0.0 /100 | #298 | Tragic 94.1% |