Kenyan vs Immigrants from Eastern Europe 5th Grade

COMPARE

Kenyan
Race
Ancestry
AfghanAfricanAlaska NativeAlaskan AthabascanAlbanianAleutAlsatianAmericanApacheArabArapahoArgentineanArmenianAssyrian/Chaldean/SyriacAustralianAustrianBahamianBangladeshiBarbadianBasqueBelgianBelizeanBermudanBhutaneseBlackfeetBolivianBrazilianBritishBritish West IndianBulgarianBurmeseCajunCambodianCanadianCape VerdeanCarpatho RusynCelticCentral AmericanCentral American IndianCherokeeCheyenneChickasawChileanChineseChippewaChoctawColombianColvilleComancheCosta RicanCreeCreekCroatianCrowCubanCypriotCzechCzechoslovakianDanishDelawareDominicanDutchDutch West IndianEastern EuropeanEcuadorianEgyptianEnglishEstonianEthiopianEuropeanFijianFilipinoFinnishFrenchFrench American IndianFrench CanadianGermanGerman RussianGhanaianGreekGuamanian/ChamorroGuatemalanGuyaneseHaitianHmongHonduranHopiHoumaHungarianIcelanderIndian (Asian)IndonesianInupiatIranianIraqiIrishIroquoisIsraeliItalianJamaicanJapaneseJordanianKenyanKiowaKoreanLaotianLatvianLebaneseLiberianLithuanianLumbeeLuxembourgerMacedonianMalaysianMalteseMarshalleseMenomineeMexicanMexican American IndianMongolianMoroccanNative HawaiianNavajoNepaleseNew ZealanderNicaraguanNigerianNorthern EuropeanNorwegianOkinawanOsageOttawaPaiutePakistaniPalestinianPanamanianParaguayanPennsylvania GermanPeruvianPimaPolishPortuguesePotawatomiPuebloPuerto RicanPuget Sound SalishRomanianRussianSalvadoranSamoanScandinavianScotch-IrishScottishSeminoleSenegaleseSerbianShoshoneSierra LeoneanSiouxSlavicSlovakSloveneSomaliSouth AfricanSouth AmericanSouth American IndianSoviet UnionSpaniardSpanishSpanish AmericanSpanish American IndianSri LankanSubsaharan AfricanSudaneseSwedishSwissSyrianTaiwaneseThaiTlingit-HaidaTohono O'OdhamTonganTrinidadian and TobagonianTsimshianTurkishU.S. Virgin IslanderUgandanUkrainianUruguayanUteVenezuelanVietnameseWelshWest IndianYakamaYaquiYugoslavianYumanYup'ikZimbabwean
Immigration
NonimmigrantsImmigrantsAfghanistanAfricaAlbaniaArgentinaArmeniaAsiaAustraliaAustriaBahamasBangladeshBarbadosBelarusBelgiumBelizeBoliviaBosnia and HerzegovinaBrazilBulgariaBurma/MyanmarCabo VerdeCambodiaCameroonCanadaCaribbeanCentral AmericaChileChinaColombiaCongoCosta RicaCroatiaCubaCzechoslovakiaDenmarkDominicaDominican RepublicEastern AfricaEastern AsiaEcuadorEgyptEl SalvadorEnglandEritreaEthiopiaEuropeFijiFranceGermanyGhanaGreeceGrenadaGuatemalaGuyanaHaitiHondurasHong KongHungaryIndiaIndonesiaIranIraqIrelandIsraelItalyJamaicaJapanJordanKazakhstanKenyaKoreaKuwaitLaosLatin AmericaLatviaLebanonLiberiaLithuaniaMalaysiaMexicoMicronesiaMiddle AfricaMoldovaMoroccoNepalNetherlandsNicaraguaNigeriaNorth AmericaNorth MacedoniaNorthern AfricaNorthern EuropeNorwayOceaniaPakistanPanamaPeruPhilippinesPolandPortugalRomaniaRussiaSaudi ArabiaScotlandSenegalSerbiaSierra LeoneSingaporeSomaliaSouth AfricaSouth AmericaSouth Central AsiaSouth Eastern AsiaSouthern EuropeSpainSri LankaSt. Vincent and the GrenadinesSudanSwedenSwitzerlandSyriaTaiwanThailandTrinidad and TobagoTurkeyUgandaUkraineUruguayUzbekistanVenezuelaVietnamWest IndiesWestern AfricaWestern AsiaWestern EuropeYemenZaireZimbabweAzores
Immigrants from Eastern Europe
Race
Ancestry
AfghanAfricanAlaska NativeAlaskan AthabascanAlbanianAleutAlsatianAmericanApacheArabArapahoArgentineanArmenianAssyrian/Chaldean/SyriacAustralianAustrianBahamianBangladeshiBarbadianBasqueBelgianBelizeanBermudanBhutaneseBlackfeetBolivianBrazilianBritishBritish West IndianBulgarianBurmeseCajunCambodianCanadianCape VerdeanCarpatho RusynCelticCentral AmericanCentral American IndianCherokeeCheyenneChickasawChileanChineseChippewaChoctawColombianColvilleComancheCosta RicanCreeCreekCroatianCrowCubanCypriotCzechCzechoslovakianDanishDelawareDominicanDutchDutch West IndianEastern EuropeanEcuadorianEgyptianEnglishEstonianEthiopianEuropeanFijianFilipinoFinnishFrenchFrench American IndianFrench CanadianGermanGerman RussianGhanaianGreekGuamanian/ChamorroGuatemalanGuyaneseHaitianHmongHonduranHopiHoumaHungarianIcelanderIndian (Asian)IndonesianInupiatIranianIraqiIrishIroquoisIsraeliItalianJamaicanJapaneseJordanianKiowaKoreanLaotianLatvianLebaneseLiberianLithuanianLumbeeLuxembourgerMacedonianMalaysianMalteseMarshalleseMenomineeMexicanMexican American IndianMongolianMoroccanNative HawaiianNavajoNepaleseNew ZealanderNicaraguanNigerianNorthern EuropeanNorwegianOkinawanOsageOttawaPaiutePakistaniPalestinianPanamanianParaguayanPennsylvania GermanPeruvianPimaPolishPortuguesePotawatomiPuebloPuerto RicanPuget Sound SalishRomanianRussianSalvadoranSamoanScandinavianScotch-IrishScottishSeminoleSenegaleseSerbianShoshoneSierra LeoneanSiouxSlavicSlovakSloveneSomaliSouth AfricanSouth AmericanSouth American IndianSoviet UnionSpaniardSpanishSpanish AmericanSpanish American IndianSri LankanSubsaharan AfricanSudaneseSwedishSwissSyrianTaiwaneseThaiTlingit-HaidaTohono O'OdhamTonganTrinidadian and TobagonianTsimshianTurkishU.S. Virgin IslanderUgandanUkrainianUruguayanUteVenezuelanVietnameseWelshWest IndianYakamaYaquiYugoslavianYumanYup'ikZimbabwean
Immigration
NonimmigrantsImmigrantsAfghanistanAfricaAlbaniaArgentinaArmeniaAsiaAustraliaAustriaBahamasBangladeshBarbadosBelarusBelgiumBelizeBoliviaBosnia and HerzegovinaBrazilBulgariaBurma/MyanmarCabo VerdeCambodiaCameroonCanadaCaribbeanCentral AmericaChileChinaColombiaCongoCosta RicaCroatiaCubaCzechoslovakiaDenmarkDominicaDominican RepublicEastern AfricaEastern AsiaEastern EuropeEcuadorEgyptEl SalvadorEnglandEritreaEthiopiaEuropeFijiFranceGermanyGhanaGreeceGrenadaGuatemalaGuyanaHaitiHondurasHong KongHungaryIndiaIndonesiaIranIraqIrelandIsraelItalyJamaicaJapanJordanKazakhstanKenyaKoreaKuwaitLaosLatin AmericaLatviaLebanonLiberiaLithuaniaMalaysiaMexicoMicronesiaMiddle AfricaMoldovaMoroccoNepalNetherlandsNicaraguaNigeriaNorth AmericaNorth MacedoniaNorthern AfricaNorthern EuropeNorwayOceaniaPakistanPanamaPeruPhilippinesPolandPortugalRomaniaRussiaSaudi ArabiaScotlandSenegalSerbiaSierra LeoneSingaporeSomaliaSouth AfricaSouth AmericaSouth Central AsiaSouth Eastern AsiaSouthern EuropeSpainSri LankaSt. Vincent and the GrenadinesSudanSwedenSwitzerlandSyriaTaiwanThailandTrinidad and TobagoTurkeyUgandaUkraineUruguayUzbekistanVenezuelaVietnamWest IndiesWestern AfricaWestern AsiaWestern EuropeYemenZaireZimbabweAzores
5th Grade
Income
Poverty
Unemployment
Labor Participation
Family Structure
Vehicle Availability
Education Level
Disability

5th Grade Comparison

Kenyans

Immigrants from Eastern Europe

Average
Good
97.4%
5TH GRADE
59.7/ 100
METRIC RATING
161st/ 347
METRIC RANK
97.4%
5TH GRADE
75.0/ 100
METRIC RATING
151st/ 347
METRIC RANK

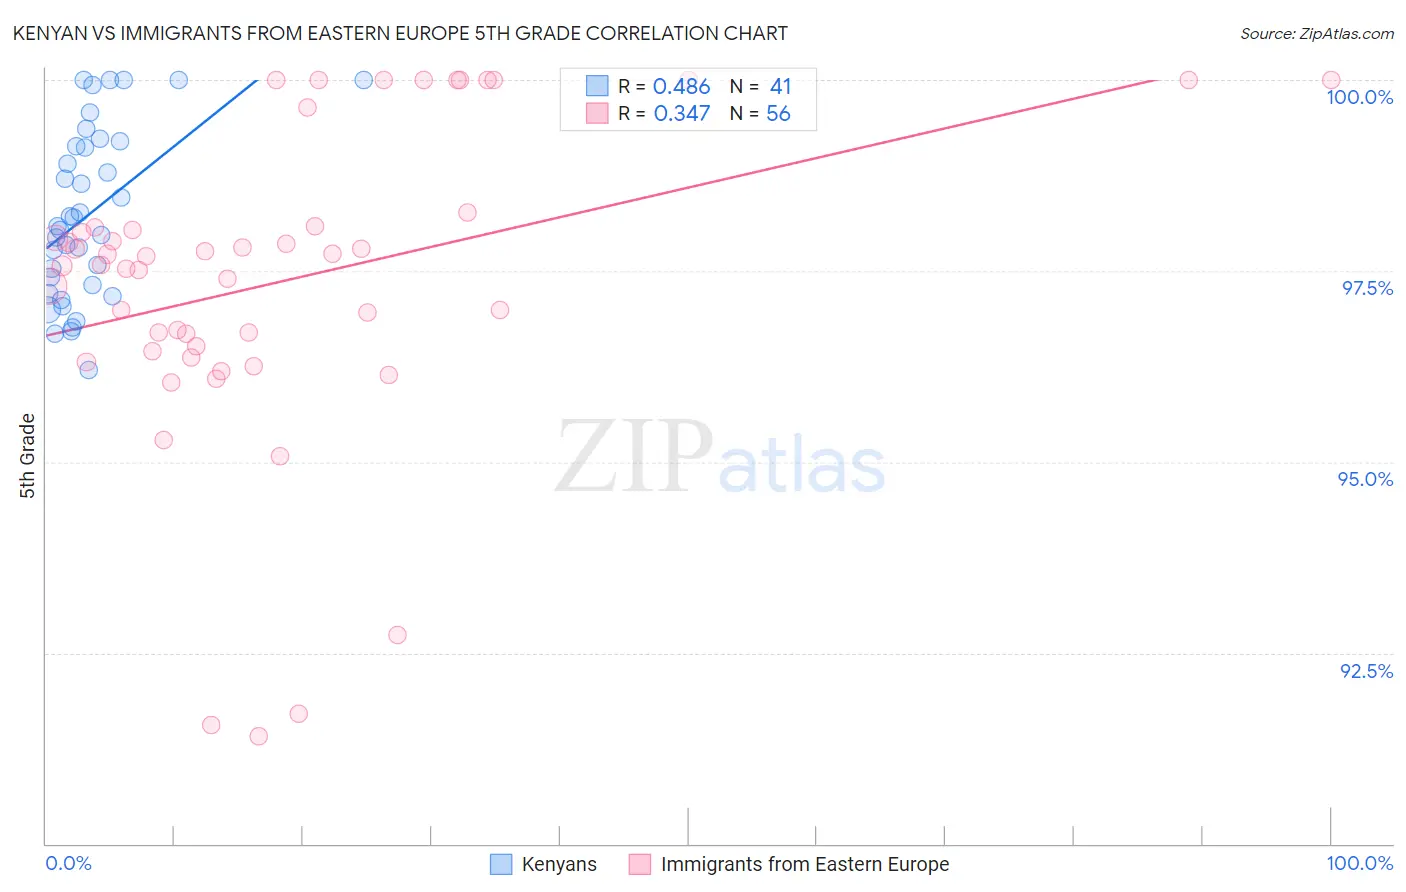
Kenyan vs Immigrants from Eastern Europe 5th Grade Correlation Chart

The statistical analysis conducted on geographies consisting of 168,244,042 people shows a moderate positive correlation between the proportion of Kenyans and percentage of population with at least 5th grade education in the United States with a correlation coefficient (R) of 0.486 and weighted average of 97.4%. Similarly, the statistical analysis conducted on geographies consisting of 475,879,420 people shows a mild positive correlation between the proportion of Immigrants from Eastern Europe and percentage of population with at least 5th grade education in the United States with a correlation coefficient (R) of 0.347 and weighted average of 97.4%, a difference of 0.070%.
Kenyan vs Immigrants from Eastern Europe 5th Grade

5th Grade Correlation Summary

MeasurementKenyanImmigrants from Eastern Europe
Minimum96.2%91.4%
Maximum100.0%100.0%
Range3.8%8.6%
Mean98.2%97.4%
Median98.1%97.6%
Interquartile 25% (IQ1)97.3%96.5%
Interquartile 75% (IQ3)99.2%98.1%
Interquartile Range (IQR)1.9%1.6%
Standard Deviation (Sample)1.1%2.1%
Standard Deviation (Population)1.1%2.0%

Demographics Similar to Kenyans and Immigrants from Eastern Europe by 5th Grade

In terms of 5th grade, the demographic groups most similar to Kenyans are Immigrants from Iran (97.4%, a difference of 0.0%), Ugandan (97.4%, a difference of 0.0%), Bermudan (97.4%, a difference of 0.0%), Marshallese (97.4%, a difference of 0.010%), and Immigrants from Poland (97.4%, a difference of 0.010%). Similarly, the demographic groups most similar to Immigrants from Eastern Europe are Ute (97.4%, a difference of 0.0%), Alsatian (97.4%, a difference of 0.0%), Immigrants from Israel (97.5%, a difference of 0.020%), Hopi (97.5%, a difference of 0.020%), and Immigrants from South Central Asia (97.5%, a difference of 0.020%).
DemographicsRating | Rank5th Grade
Spaniards
81.9
/100
|
#146
Excellent
97.5%
Soviet Union
81.2
/100
|
#147
Excellent
97.5%
Immigrants | Israel
79.1
/100
|
#148
Good
97.5%
Hopi
78.6
/100
|
#149
Good
97.5%
Immigrants | South Central Asia
78.6
/100
|
#150
Good
97.5%
Immigrants | Eastern Europe
75.0
/100
|
#151
Good
97.4%
Ute
74.9
/100
|
#152
Good
97.4%
Alsatians
74.3
/100
|
#153
Good
97.4%
Immigrants | Russia
71.2
/100
|
#154
Good
97.4%
Immigrants | Bosnia and Herzegovina
71.0
/100
|
#155
Good
97.4%
French American Indians
70.5
/100
|
#156
Good
97.4%
Immigrants | Jordan
70.4
/100
|
#157
Good
97.4%
Albanians
68.3
/100
|
#158
Good
97.4%
Immigrants | Italy
65.2
/100
|
#159
Good
97.4%
Marshallese
61.2
/100
|
#160
Good
97.4%
Kenyans
59.7
/100
|
#161
Average
97.4%
Immigrants | Iran
59.5
/100
|
#162
Average
97.4%
Ugandans
58.9
/100
|
#163
Average
97.4%
Bermudans
58.8
/100
|
#164
Average
97.4%
Immigrants | Poland
57.9
/100
|
#165
Average
97.4%
Apache
57.2
/100
|
#166
Average
97.4%