Jordanian vs Ute 3rd Grade
COMPARE
Jordanian
Ute
3rd Grade
3rd Grade Comparison
Jordanians
Ute
97.8%
3RD GRADE
74.5/ 100
METRIC RATING
150th/ 347
METRIC RANK
98.0%
3RD GRADE
93.2/ 100
METRIC RATING
127th/ 347
METRIC RANK
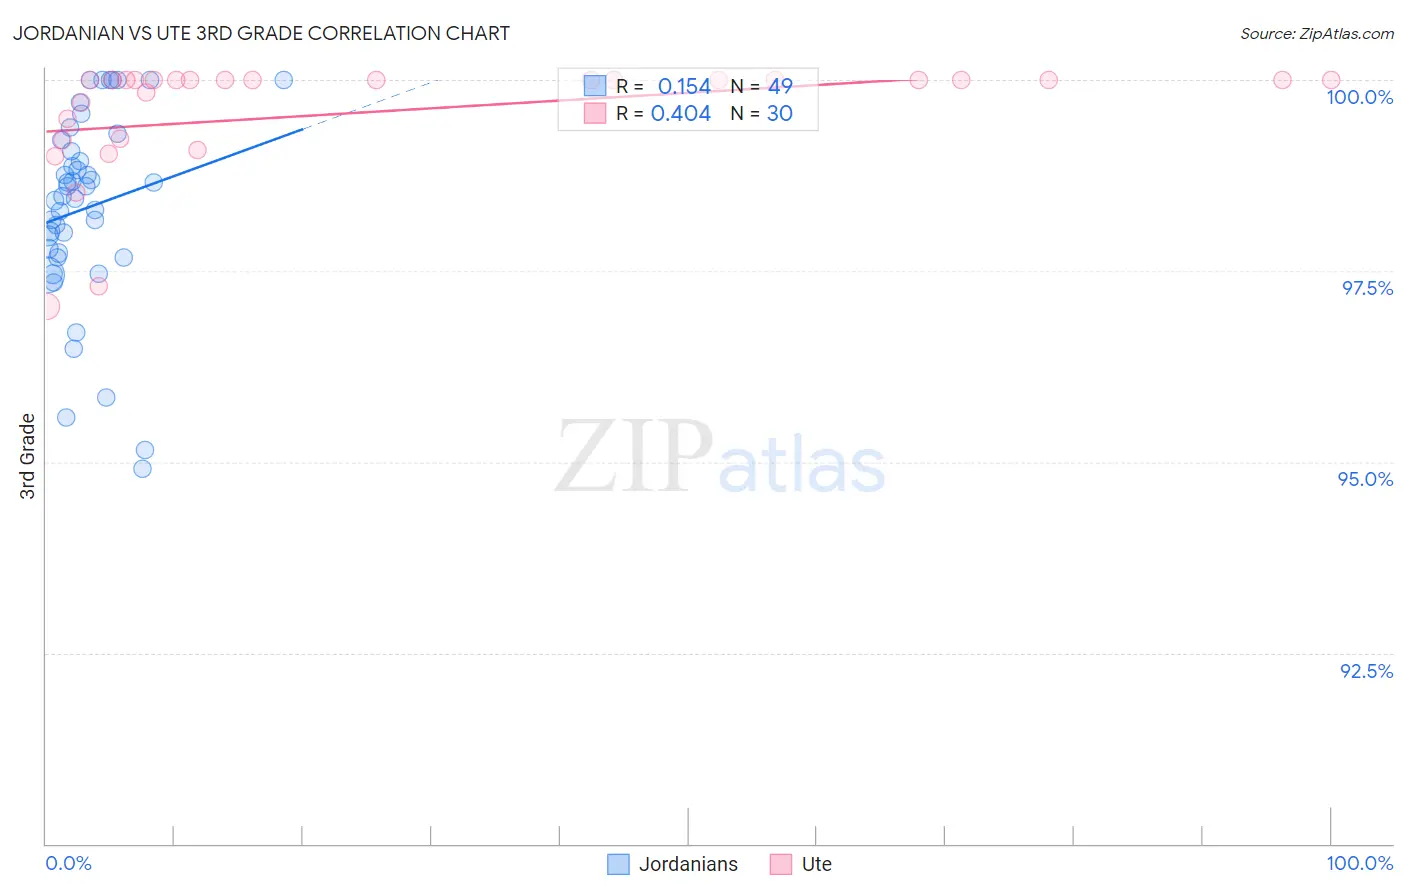
Jordanian vs Ute 3rd Grade Correlation Chart
The statistical analysis conducted on geographies consisting of 166,424,117 people shows a poor positive correlation between the proportion of Jordanians and percentage of population with at least 3rd grade education in the United States with a correlation coefficient (R) of 0.154 and weighted average of 97.8%. Similarly, the statistical analysis conducted on geographies consisting of 55,667,712 people shows a moderate positive correlation between the proportion of Ute and percentage of population with at least 3rd grade education in the United States with a correlation coefficient (R) of 0.404 and weighted average of 98.0%, a difference of 0.13%.
3rd Grade Correlation Summary
| Measurement | Jordanian | Ute |
| Minimum | 94.9% | 97.0% |
| Maximum | 100.0% | 100.0% |
| Range | 5.1% | 3.0% |
| Mean | 98.3% | 99.6% |
| Median | 98.5% | 100.0% |
| Interquartile 25% (IQ1) | 97.7% | 99.2% |
| Interquartile 75% (IQ3) | 99.1% | 100.0% |
| Interquartile Range (IQR) | 1.4% | 0.77% |
| Standard Deviation (Sample) | 1.3% | 0.77% |
| Standard Deviation (Population) | 1.2% | 0.76% |
Similar Demographics by 3rd Grade
Demographics Similar to Jordanians by 3rd Grade
In terms of 3rd grade, the demographic groups most similar to Jordanians are Immigrants from North Macedonia (97.8%, a difference of 0.0%), Immigrants from Israel (97.9%, a difference of 0.010%), Immigrants from Moldova (97.9%, a difference of 0.010%), Soviet Union (97.8%, a difference of 0.010%), and Burmese (97.9%, a difference of 0.020%).
| Demographics | Rating | Rank | 3rd Grade |
| Filipinos | 79.9 /100 | #143 | Good 97.9% |
| Burmese | 79.6 /100 | #144 | Good 97.9% |
| Immigrants | Greece | 79.5 /100 | #145 | Good 97.9% |
| Alsatians | 78.3 /100 | #146 | Good 97.9% |
| Immigrants | Israel | 77.3 /100 | #147 | Good 97.9% |
| Immigrants | Moldova | 77.1 /100 | #148 | Good 97.9% |
| Immigrants | North Macedonia | 74.5 /100 | #149 | Good 97.8% |
| Jordanians | 74.5 /100 | #150 | Good 97.8% |
| Soviet Union | 72.6 /100 | #151 | Good 97.8% |
| Immigrants | South Central Asia | 69.5 /100 | #152 | Good 97.8% |
| Apache | 68.5 /100 | #153 | Good 97.8% |
| Immigrants | Eastern Europe | 64.1 /100 | #154 | Good 97.8% |
| Bermudans | 62.6 /100 | #155 | Good 97.8% |
| Immigrants | Russia | 61.7 /100 | #156 | Good 97.8% |
| Immigrants | Italy | 61.2 /100 | #157 | Good 97.8% |
Demographics Similar to Ute by 3rd Grade
In terms of 3rd grade, the demographic groups most similar to Ute are Immigrants from Saudi Arabia (98.0%, a difference of 0.0%), Immigrants from Zimbabwe (98.0%, a difference of 0.0%), Iroquois (98.0%, a difference of 0.010%), Lebanese (98.0%, a difference of 0.010%), and Syrian (98.0%, a difference of 0.010%).
| Demographics | Rating | Rank | 3rd Grade |
| Immigrants | Croatia | 94.4 /100 | #120 | Exceptional 98.0% |
| Iroquois | 94.1 /100 | #121 | Exceptional 98.0% |
| Lebanese | 94.1 /100 | #122 | Exceptional 98.0% |
| Syrians | 93.8 /100 | #123 | Exceptional 98.0% |
| Immigrants | Japan | 93.7 /100 | #124 | Exceptional 98.0% |
| Immigrants | Saudi Arabia | 93.5 /100 | #125 | Exceptional 98.0% |
| Immigrants | Zimbabwe | 93.4 /100 | #126 | Exceptional 98.0% |
| Ute | 93.2 /100 | #127 | Exceptional 98.0% |
| Colville | 92.1 /100 | #128 | Exceptional 98.0% |
| Immigrants | Serbia | 91.9 /100 | #129 | Exceptional 98.0% |
| Immigrants | Europe | 91.2 /100 | #130 | Exceptional 98.0% |
| Immigrants | Bulgaria | 89.1 /100 | #131 | Excellent 97.9% |
| Immigrants | Hungary | 88.8 /100 | #132 | Excellent 97.9% |
| Immigrants | Kuwait | 88.7 /100 | #133 | Excellent 97.9% |
| Seminole | 88.7 /100 | #134 | Excellent 97.9% |