Jordanian vs Immigrants from Morocco 3rd Grade
COMPARE
Jordanian
Immigrants from Morocco
3rd Grade
3rd Grade Comparison
Jordanians
Immigrants from Morocco
97.8%
3RD GRADE
74.5/ 100
METRIC RATING
150th/ 347
METRIC RANK
97.5%
3RD GRADE
5.0/ 100
METRIC RATING
220th/ 347
METRIC RANK
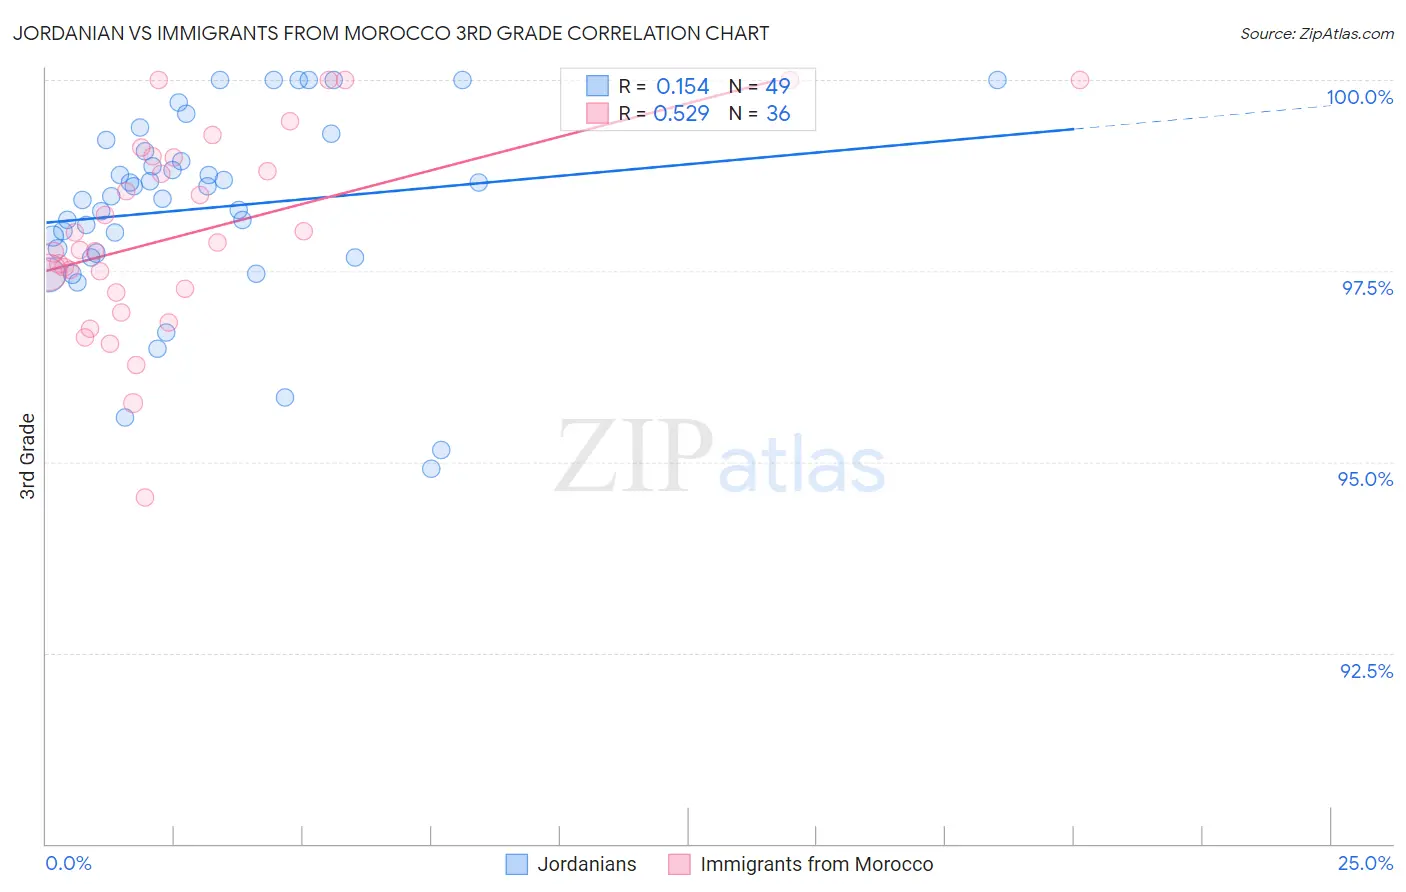
Jordanian vs Immigrants from Morocco 3rd Grade Correlation Chart
The statistical analysis conducted on geographies consisting of 166,424,117 people shows a poor positive correlation between the proportion of Jordanians and percentage of population with at least 3rd grade education in the United States with a correlation coefficient (R) of 0.154 and weighted average of 97.8%. Similarly, the statistical analysis conducted on geographies consisting of 178,910,634 people shows a substantial positive correlation between the proportion of Immigrants from Morocco and percentage of population with at least 3rd grade education in the United States with a correlation coefficient (R) of 0.529 and weighted average of 97.5%, a difference of 0.34%.
3rd Grade Correlation Summary
| Measurement | Jordanian | Immigrants from Morocco |
| Minimum | 94.9% | 94.5% |
| Maximum | 100.0% | 100.0% |
| Range | 5.1% | 5.5% |
| Mean | 98.3% | 98.0% |
| Median | 98.5% | 97.8% |
| Interquartile 25% (IQ1) | 97.7% | 97.2% |
| Interquartile 75% (IQ3) | 99.1% | 99.0% |
| Interquartile Range (IQR) | 1.4% | 1.7% |
| Standard Deviation (Sample) | 1.3% | 1.3% |
| Standard Deviation (Population) | 1.2% | 1.3% |
Similar Demographics by 3rd Grade
Demographics Similar to Jordanians by 3rd Grade
In terms of 3rd grade, the demographic groups most similar to Jordanians are Immigrants from North Macedonia (97.8%, a difference of 0.0%), Immigrants from Israel (97.9%, a difference of 0.010%), Immigrants from Moldova (97.9%, a difference of 0.010%), Soviet Union (97.8%, a difference of 0.010%), and Burmese (97.9%, a difference of 0.020%).
| Demographics | Rating | Rank | 3rd Grade |
| Filipinos | 79.9 /100 | #143 | Good 97.9% |
| Burmese | 79.6 /100 | #144 | Good 97.9% |
| Immigrants | Greece | 79.5 /100 | #145 | Good 97.9% |
| Alsatians | 78.3 /100 | #146 | Good 97.9% |
| Immigrants | Israel | 77.3 /100 | #147 | Good 97.9% |
| Immigrants | Moldova | 77.1 /100 | #148 | Good 97.9% |
| Immigrants | North Macedonia | 74.5 /100 | #149 | Good 97.8% |
| Jordanians | 74.5 /100 | #150 | Good 97.8% |
| Soviet Union | 72.6 /100 | #151 | Good 97.8% |
| Immigrants | South Central Asia | 69.5 /100 | #152 | Good 97.8% |
| Apache | 68.5 /100 | #153 | Good 97.8% |
| Immigrants | Eastern Europe | 64.1 /100 | #154 | Good 97.8% |
| Bermudans | 62.6 /100 | #155 | Good 97.8% |
| Immigrants | Russia | 61.7 /100 | #156 | Good 97.8% |
| Immigrants | Italy | 61.2 /100 | #157 | Good 97.8% |
Demographics Similar to Immigrants from Morocco by 3rd Grade
In terms of 3rd grade, the demographic groups most similar to Immigrants from Morocco are Immigrants from Nepal (97.5%, a difference of 0.0%), Immigrants from Panama (97.5%, a difference of 0.0%), Uruguayan (97.5%, a difference of 0.0%), South American Indian (97.5%, a difference of 0.010%), and Sierra Leonean (97.5%, a difference of 0.010%).
| Demographics | Rating | Rank | 3rd Grade |
| Moroccans | 8.5 /100 | #213 | Tragic 97.6% |
| Yuman | 8.4 /100 | #214 | Tragic 97.6% |
| Iraqis | 6.9 /100 | #215 | Tragic 97.5% |
| Samoans | 6.9 /100 | #216 | Tragic 97.5% |
| South American Indians | 5.7 /100 | #217 | Tragic 97.5% |
| Immigrants | Nepal | 5.3 /100 | #218 | Tragic 97.5% |
| Immigrants | Panama | 5.2 /100 | #219 | Tragic 97.5% |
| Immigrants | Morocco | 5.0 /100 | #220 | Tragic 97.5% |
| Uruguayans | 5.0 /100 | #221 | Tragic 97.5% |
| Sierra Leoneans | 4.6 /100 | #222 | Tragic 97.5% |
| Immigrants | Syria | 4.4 /100 | #223 | Tragic 97.5% |
| Bahamians | 4.4 /100 | #224 | Tragic 97.5% |
| Tongans | 4.3 /100 | #225 | Tragic 97.5% |
| Sudanese | 4.1 /100 | #226 | Tragic 97.5% |
| Immigrants | Sudan | 3.4 /100 | #227 | Tragic 97.5% |