Senegalese vs Ute 3rd Grade
COMPARE
Senegalese
Ute
3rd Grade
3rd Grade Comparison
Senegalese
Ute
97.5%
3RD GRADE
3.0/ 100
METRIC RATING
229th/ 347
METRIC RANK
98.0%
3RD GRADE
93.2/ 100
METRIC RATING
127th/ 347
METRIC RANK
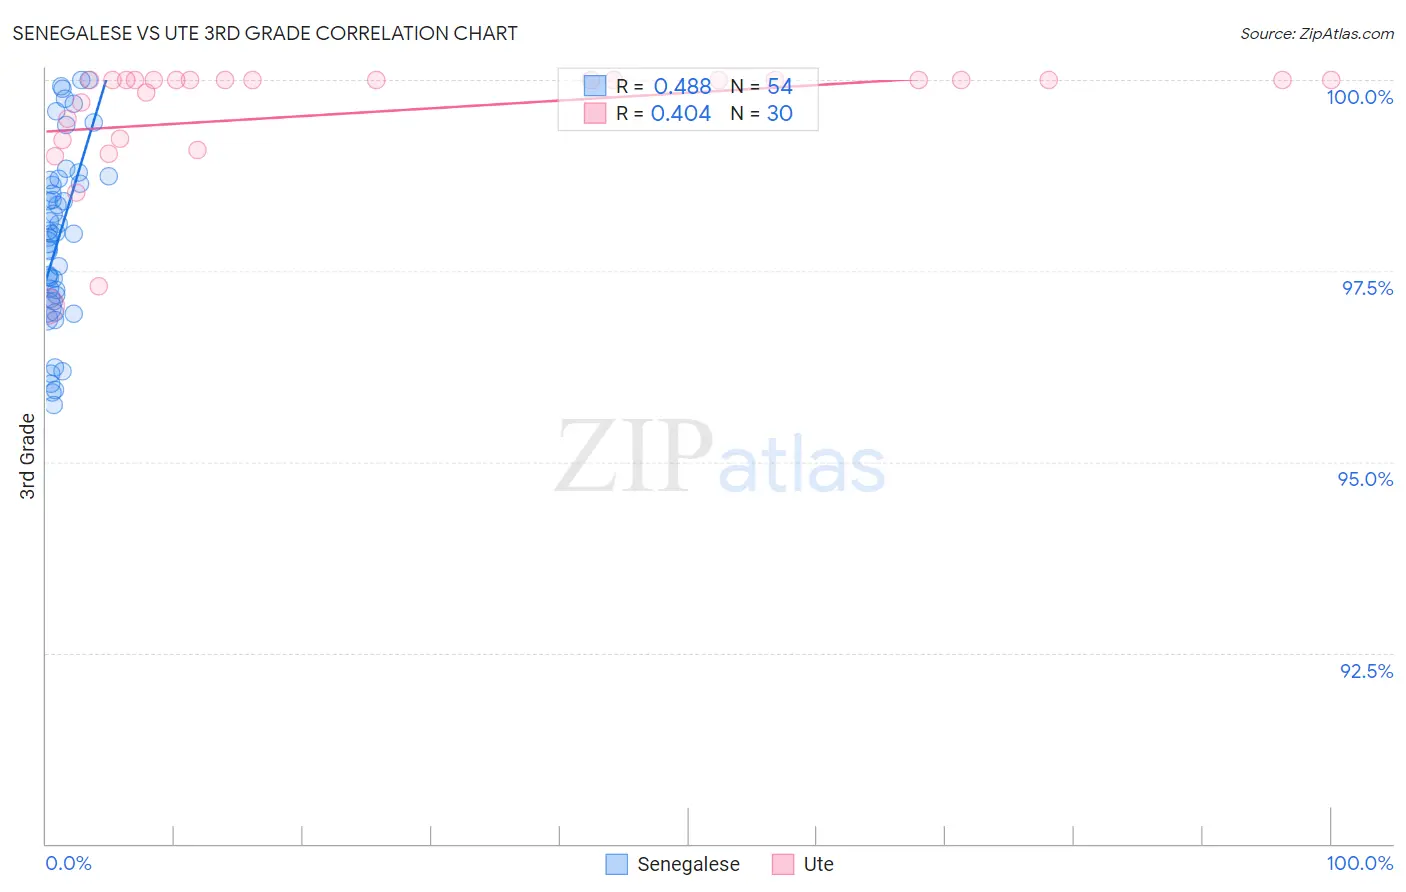
Senegalese vs Ute 3rd Grade Correlation Chart
The statistical analysis conducted on geographies consisting of 78,142,569 people shows a moderate positive correlation between the proportion of Senegalese and percentage of population with at least 3rd grade education in the United States with a correlation coefficient (R) of 0.488 and weighted average of 97.5%. Similarly, the statistical analysis conducted on geographies consisting of 55,667,712 people shows a moderate positive correlation between the proportion of Ute and percentage of population with at least 3rd grade education in the United States with a correlation coefficient (R) of 0.404 and weighted average of 98.0%, a difference of 0.52%.
3rd Grade Correlation Summary
| Measurement | Senegalese | Ute |
| Minimum | 95.7% | 97.0% |
| Maximum | 100.0% | 100.0% |
| Range | 4.3% | 3.0% |
| Mean | 97.9% | 99.6% |
| Median | 98.0% | 100.0% |
| Interquartile 25% (IQ1) | 97.1% | 99.2% |
| Interquartile 75% (IQ3) | 98.7% | 100.0% |
| Interquartile Range (IQR) | 1.6% | 0.77% |
| Standard Deviation (Sample) | 1.2% | 0.77% |
| Standard Deviation (Population) | 1.1% | 0.76% |
Similar Demographics by 3rd Grade
Demographics Similar to Senegalese by 3rd Grade
In terms of 3rd grade, the demographic groups most similar to Senegalese are Immigrants from Sudan (97.5%, a difference of 0.010%), Subsaharan African (97.5%, a difference of 0.010%), Immigrants from Pakistan (97.5%, a difference of 0.010%), Immigrants from Costa Rica (97.5%, a difference of 0.010%), and Immigrants from Western Asia (97.5%, a difference of 0.010%).
| Demographics | Rating | Rank | 3rd Grade |
| Sierra Leoneans | 4.6 /100 | #222 | Tragic 97.5% |
| Immigrants | Syria | 4.4 /100 | #223 | Tragic 97.5% |
| Bahamians | 4.4 /100 | #224 | Tragic 97.5% |
| Tongans | 4.3 /100 | #225 | Tragic 97.5% |
| Sudanese | 4.1 /100 | #226 | Tragic 97.5% |
| Immigrants | Sudan | 3.4 /100 | #227 | Tragic 97.5% |
| Sub-Saharan Africans | 3.2 /100 | #228 | Tragic 97.5% |
| Senegalese | 3.0 /100 | #229 | Tragic 97.5% |
| Immigrants | Pakistan | 2.7 /100 | #230 | Tragic 97.5% |
| Immigrants | Costa Rica | 2.7 /100 | #231 | Tragic 97.5% |
| Immigrants | Western Asia | 2.6 /100 | #232 | Tragic 97.5% |
| Immigrants | Malaysia | 2.4 /100 | #233 | Tragic 97.5% |
| Immigrants | Eastern Asia | 1.9 /100 | #234 | Tragic 97.4% |
| Immigrants | Iraq | 1.8 /100 | #235 | Tragic 97.4% |
| Liberians | 1.8 /100 | #236 | Tragic 97.4% |
Demographics Similar to Ute by 3rd Grade
In terms of 3rd grade, the demographic groups most similar to Ute are Immigrants from Saudi Arabia (98.0%, a difference of 0.0%), Immigrants from Zimbabwe (98.0%, a difference of 0.0%), Iroquois (98.0%, a difference of 0.010%), Lebanese (98.0%, a difference of 0.010%), and Syrian (98.0%, a difference of 0.010%).
| Demographics | Rating | Rank | 3rd Grade |
| Immigrants | Croatia | 94.4 /100 | #120 | Exceptional 98.0% |
| Iroquois | 94.1 /100 | #121 | Exceptional 98.0% |
| Lebanese | 94.1 /100 | #122 | Exceptional 98.0% |
| Syrians | 93.8 /100 | #123 | Exceptional 98.0% |
| Immigrants | Japan | 93.7 /100 | #124 | Exceptional 98.0% |
| Immigrants | Saudi Arabia | 93.5 /100 | #125 | Exceptional 98.0% |
| Immigrants | Zimbabwe | 93.4 /100 | #126 | Exceptional 98.0% |
| Ute | 93.2 /100 | #127 | Exceptional 98.0% |
| Colville | 92.1 /100 | #128 | Exceptional 98.0% |
| Immigrants | Serbia | 91.9 /100 | #129 | Exceptional 98.0% |
| Immigrants | Europe | 91.2 /100 | #130 | Exceptional 98.0% |
| Immigrants | Bulgaria | 89.1 /100 | #131 | Excellent 97.9% |
| Immigrants | Hungary | 88.8 /100 | #132 | Excellent 97.9% |
| Immigrants | Kuwait | 88.7 /100 | #133 | Excellent 97.9% |
| Seminole | 88.7 /100 | #134 | Excellent 97.9% |