Immigrants from Ecuador vs Ute 3rd Grade
COMPARE
Immigrants from Ecuador
Ute
3rd Grade
3rd Grade Comparison
Immigrants from Ecuador
Ute
96.6%
3RD GRADE
0.0/ 100
METRIC RATING
313th/ 347
METRIC RANK
98.0%
3RD GRADE
93.2/ 100
METRIC RATING
127th/ 347
METRIC RANK
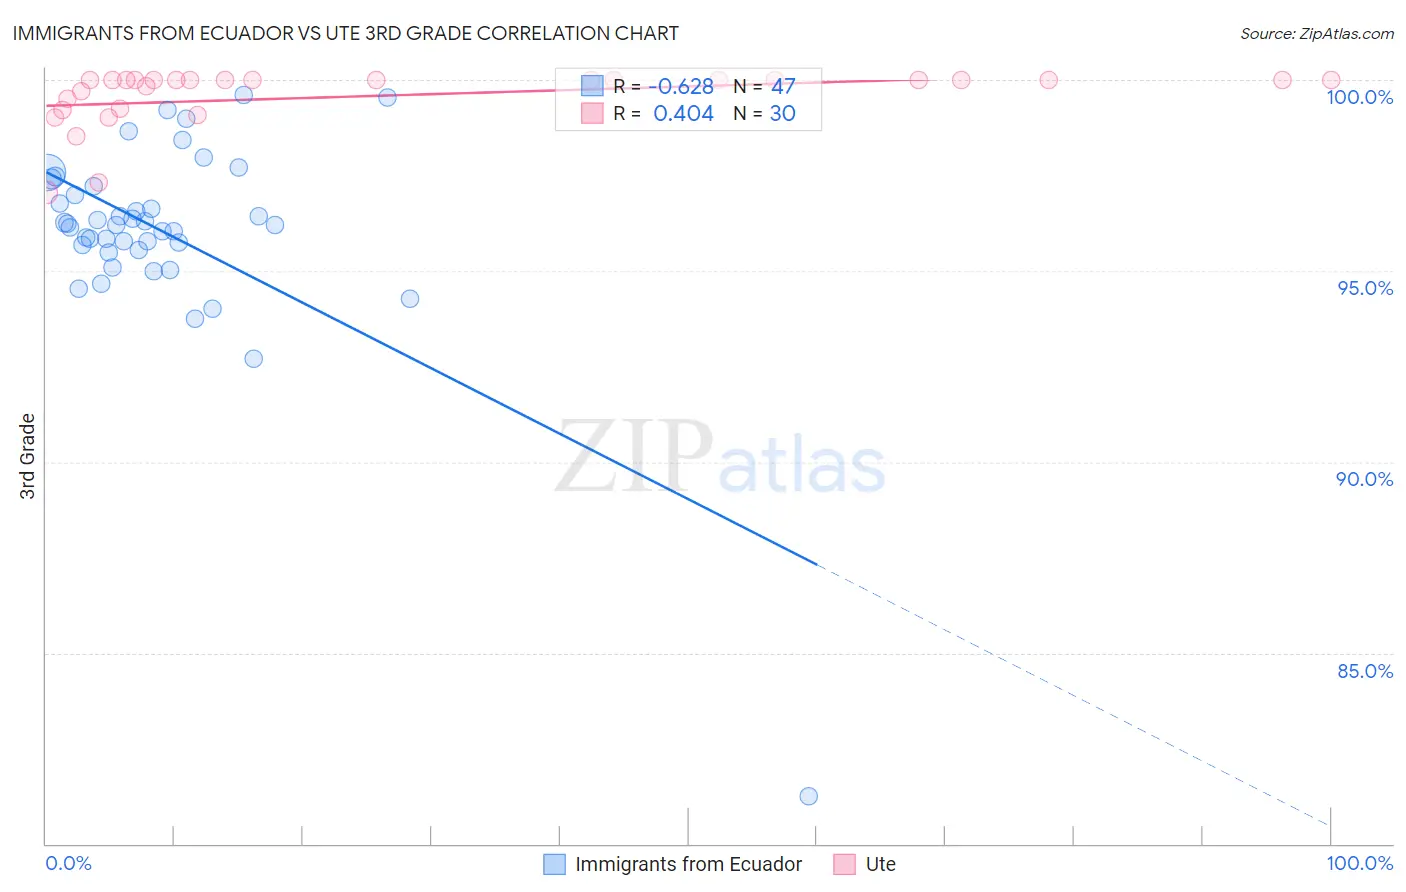
Immigrants from Ecuador vs Ute 3rd Grade Correlation Chart
The statistical analysis conducted on geographies consisting of 271,020,679 people shows a significant negative correlation between the proportion of Immigrants from Ecuador and percentage of population with at least 3rd grade education in the United States with a correlation coefficient (R) of -0.628 and weighted average of 96.6%. Similarly, the statistical analysis conducted on geographies consisting of 55,667,712 people shows a moderate positive correlation between the proportion of Ute and percentage of population with at least 3rd grade education in the United States with a correlation coefficient (R) of 0.404 and weighted average of 98.0%, a difference of 1.4%.
3rd Grade Correlation Summary
| Measurement | Immigrants from Ecuador | Ute |
| Minimum | 81.2% | 97.0% |
| Maximum | 99.6% | 100.0% |
| Range | 18.3% | 3.0% |
| Mean | 96.0% | 99.6% |
| Median | 96.2% | 100.0% |
| Interquartile 25% (IQ1) | 95.5% | 99.2% |
| Interquartile 75% (IQ3) | 97.2% | 100.0% |
| Interquartile Range (IQR) | 1.7% | 0.77% |
| Standard Deviation (Sample) | 2.7% | 0.77% |
| Standard Deviation (Population) | 2.6% | 0.76% |
Similar Demographics by 3rd Grade
Demographics Similar to Immigrants from Ecuador by 3rd Grade
In terms of 3rd grade, the demographic groups most similar to Immigrants from Ecuador are Belizean (96.6%, a difference of 0.0%), Immigrants from Laos (96.6%, a difference of 0.010%), Immigrants from the Azores (96.6%, a difference of 0.010%), Immigrants from Burma/Myanmar (96.6%, a difference of 0.020%), and Immigrants from Guyana (96.6%, a difference of 0.030%).
| Demographics | Rating | Rank | 3rd Grade |
| Guyanese | 0.0 /100 | #306 | Tragic 96.7% |
| Nicaraguans | 0.0 /100 | #307 | Tragic 96.7% |
| Immigrants | Haiti | 0.0 /100 | #308 | Tragic 96.7% |
| Sri Lankans | 0.0 /100 | #309 | Tragic 96.7% |
| Cape Verdeans | 0.0 /100 | #310 | Tragic 96.6% |
| Immigrants | Guyana | 0.0 /100 | #311 | Tragic 96.6% |
| Immigrants | Laos | 0.0 /100 | #312 | Tragic 96.6% |
| Immigrants | Ecuador | 0.0 /100 | #313 | Tragic 96.6% |
| Belizeans | 0.0 /100 | #314 | Tragic 96.6% |
| Immigrants | Azores | 0.0 /100 | #315 | Tragic 96.6% |
| Immigrants | Burma/Myanmar | 0.0 /100 | #316 | Tragic 96.6% |
| Immigrants | Bangladesh | 0.0 /100 | #317 | Tragic 96.6% |
| Hispanics or Latinos | 0.0 /100 | #318 | Tragic 96.5% |
| Vietnamese | 0.0 /100 | #319 | Tragic 96.5% |
| Immigrants | Nicaragua | 0.0 /100 | #320 | Tragic 96.5% |
Demographics Similar to Ute by 3rd Grade
In terms of 3rd grade, the demographic groups most similar to Ute are Immigrants from Saudi Arabia (98.0%, a difference of 0.0%), Immigrants from Zimbabwe (98.0%, a difference of 0.0%), Iroquois (98.0%, a difference of 0.010%), Lebanese (98.0%, a difference of 0.010%), and Syrian (98.0%, a difference of 0.010%).
| Demographics | Rating | Rank | 3rd Grade |
| Immigrants | Croatia | 94.4 /100 | #120 | Exceptional 98.0% |
| Iroquois | 94.1 /100 | #121 | Exceptional 98.0% |
| Lebanese | 94.1 /100 | #122 | Exceptional 98.0% |
| Syrians | 93.8 /100 | #123 | Exceptional 98.0% |
| Immigrants | Japan | 93.7 /100 | #124 | Exceptional 98.0% |
| Immigrants | Saudi Arabia | 93.5 /100 | #125 | Exceptional 98.0% |
| Immigrants | Zimbabwe | 93.4 /100 | #126 | Exceptional 98.0% |
| Ute | 93.2 /100 | #127 | Exceptional 98.0% |
| Colville | 92.1 /100 | #128 | Exceptional 98.0% |
| Immigrants | Serbia | 91.9 /100 | #129 | Exceptional 98.0% |
| Immigrants | Europe | 91.2 /100 | #130 | Exceptional 98.0% |
| Immigrants | Bulgaria | 89.1 /100 | #131 | Excellent 97.9% |
| Immigrants | Hungary | 88.8 /100 | #132 | Excellent 97.9% |
| Immigrants | Kuwait | 88.7 /100 | #133 | Excellent 97.9% |
| Seminole | 88.7 /100 | #134 | Excellent 97.9% |