Immigrants from Germany vs Spanish American High School Diploma
COMPARE
Immigrants from Germany
Spanish American
High School Diploma
High School Diploma Comparison
Immigrants from Germany
Spanish Americans
90.2%
HIGH SCHOOL DIPLOMA
95.7/ 100
METRIC RATING
116th/ 347
METRIC RANK
87.7%
HIGH SCHOOL DIPLOMA
1.5/ 100
METRIC RATING
248th/ 347
METRIC RANK
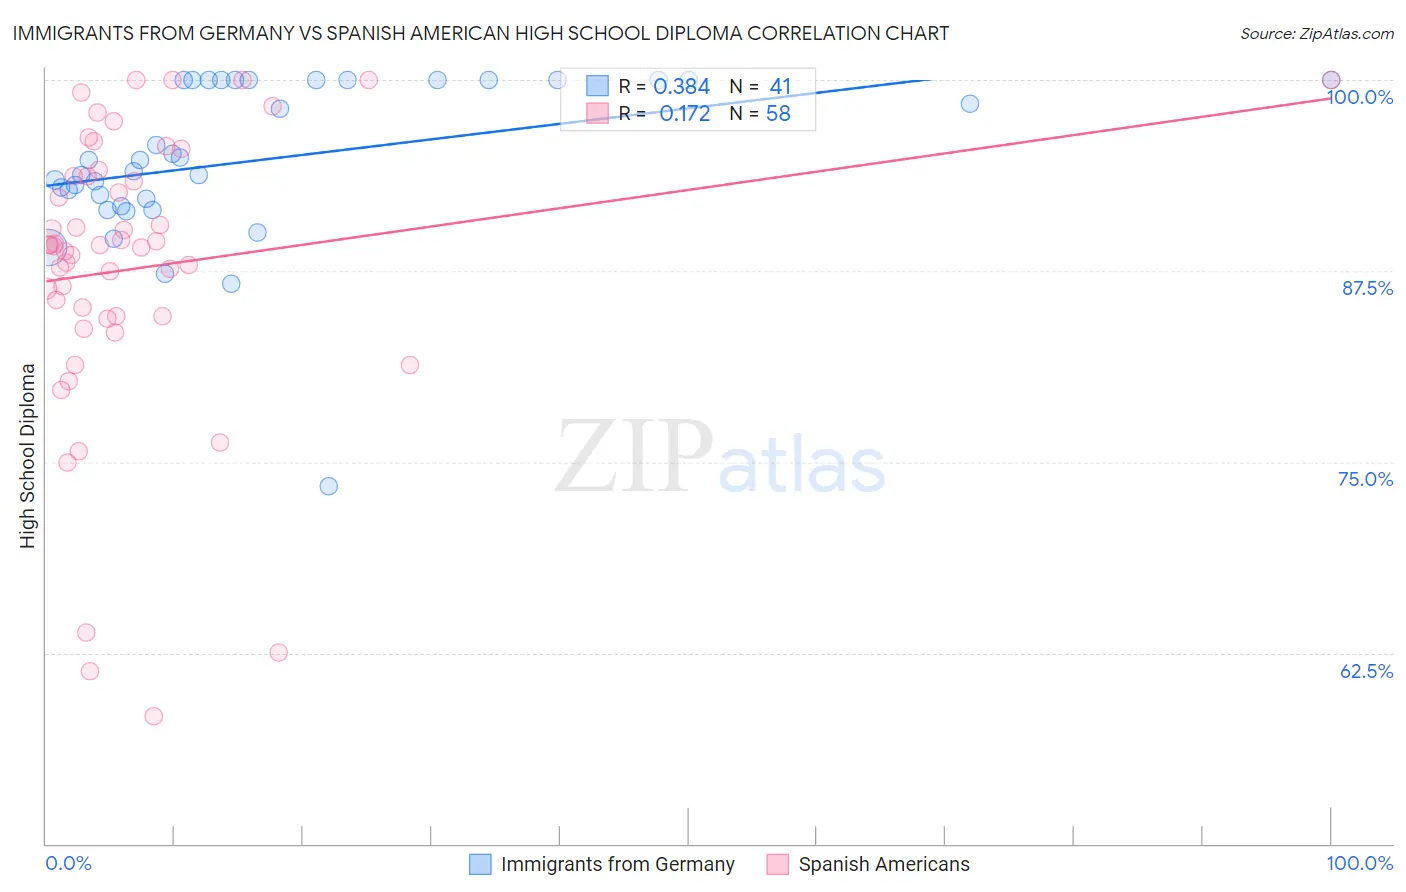
Immigrants from Germany vs Spanish American High School Diploma Correlation Chart
The statistical analysis conducted on geographies consisting of 463,886,776 people shows a mild positive correlation between the proportion of Immigrants from Germany and percentage of population with at least high school diploma education in the United States with a correlation coefficient (R) of 0.384 and weighted average of 90.2%. Similarly, the statistical analysis conducted on geographies consisting of 103,166,592 people shows a poor positive correlation between the proportion of Spanish Americans and percentage of population with at least high school diploma education in the United States with a correlation coefficient (R) of 0.172 and weighted average of 87.7%, a difference of 2.8%.
High School Diploma Correlation Summary
| Measurement | Immigrants from Germany | Spanish American |
| Minimum | 73.4% | 58.3% |
| Maximum | 100.0% | 100.0% |
| Range | 26.6% | 41.7% |
| Mean | 94.8% | 87.7% |
| Median | 94.7% | 89.2% |
| Interquartile 25% (IQ1) | 92.0% | 84.5% |
| Interquartile 75% (IQ3) | 100.0% | 93.7% |
| Interquartile Range (IQR) | 8.0% | 9.2% |
| Standard Deviation (Sample) | 5.3% | 9.5% |
| Standard Deviation (Population) | 5.3% | 9.5% |
Similar Demographics by High School Diploma
Demographics Similar to Immigrants from Germany by High School Diploma
In terms of high school diploma, the demographic groups most similar to Immigrants from Germany are Immigrants from Hungary (90.2%, a difference of 0.010%), Jordanian (90.2%, a difference of 0.030%), Yugoslavian (90.2%, a difference of 0.050%), Israeli (90.1%, a difference of 0.050%), and Immigrants from Sri Lanka (90.2%, a difference of 0.060%).
| Demographics | Rating | Rank | High School Diploma |
| Immigrants | Zimbabwe | 96.7 /100 | #109 | Exceptional 90.3% |
| Immigrants | Greece | 96.6 /100 | #110 | Exceptional 90.3% |
| Menominee | 96.6 /100 | #111 | Exceptional 90.3% |
| Immigrants | Belarus | 96.4 /100 | #112 | Exceptional 90.2% |
| Immigrants | Sri Lanka | 96.3 /100 | #113 | Exceptional 90.2% |
| Yugoslavians | 96.2 /100 | #114 | Exceptional 90.2% |
| Immigrants | Hungary | 95.8 /100 | #115 | Exceptional 90.2% |
| Immigrants | Germany | 95.7 /100 | #116 | Exceptional 90.2% |
| Jordanians | 95.4 /100 | #117 | Exceptional 90.2% |
| Israelis | 95.1 /100 | #118 | Exceptional 90.1% |
| Immigrants | Eastern Europe | 94.9 /100 | #119 | Exceptional 90.1% |
| Ottawa | 94.4 /100 | #120 | Exceptional 90.1% |
| Whites/Caucasians | 94.1 /100 | #121 | Exceptional 90.1% |
| Immigrants | Kazakhstan | 93.4 /100 | #122 | Exceptional 90.0% |
| German Russians | 92.0 /100 | #123 | Exceptional 90.0% |
Demographics Similar to Spanish Americans by High School Diploma
In terms of high school diploma, the demographic groups most similar to Spanish Americans are Senegalese (87.7%, a difference of 0.010%), Immigrants from Nigeria (87.7%, a difference of 0.010%), Immigrants from Eritrea (87.8%, a difference of 0.040%), Immigrants from Costa Rica (87.8%, a difference of 0.040%), and Ghanaian (87.7%, a difference of 0.050%).
| Demographics | Rating | Rank | High School Diploma |
| Immigrants | Uzbekistan | 2.1 /100 | #241 | Tragic 87.8% |
| Cheyenne | 2.1 /100 | #242 | Tragic 87.8% |
| Immigrants | Philippines | 1.9 /100 | #243 | Tragic 87.8% |
| Choctaw | 1.9 /100 | #244 | Tragic 87.8% |
| Peruvians | 1.9 /100 | #245 | Tragic 87.8% |
| Immigrants | Eritrea | 1.7 /100 | #246 | Tragic 87.8% |
| Immigrants | Costa Rica | 1.7 /100 | #247 | Tragic 87.8% |
| Spanish Americans | 1.5 /100 | #248 | Tragic 87.7% |
| Senegalese | 1.5 /100 | #249 | Tragic 87.7% |
| Immigrants | Nigeria | 1.5 /100 | #250 | Tragic 87.7% |
| Ghanaians | 1.4 /100 | #251 | Tragic 87.7% |
| Immigrants | South America | 1.2 /100 | #252 | Tragic 87.6% |
| Immigrants | Uruguay | 1.0 /100 | #253 | Tragic 87.6% |
| Immigrants | Colombia | 1.0 /100 | #254 | Tragic 87.6% |
| Immigrants | Senegal | 0.9 /100 | #255 | Tragic 87.6% |