Belizean vs Slavic 3rd Grade
COMPARE
Belizean
Slavic
3rd Grade
3rd Grade Comparison
Belizeans
Slavs
96.6%
3RD GRADE
0.0/ 100
METRIC RATING
314th/ 347
METRIC RANK
98.3%
3RD GRADE
99.7/ 100
METRIC RATING
57th/ 347
METRIC RANK
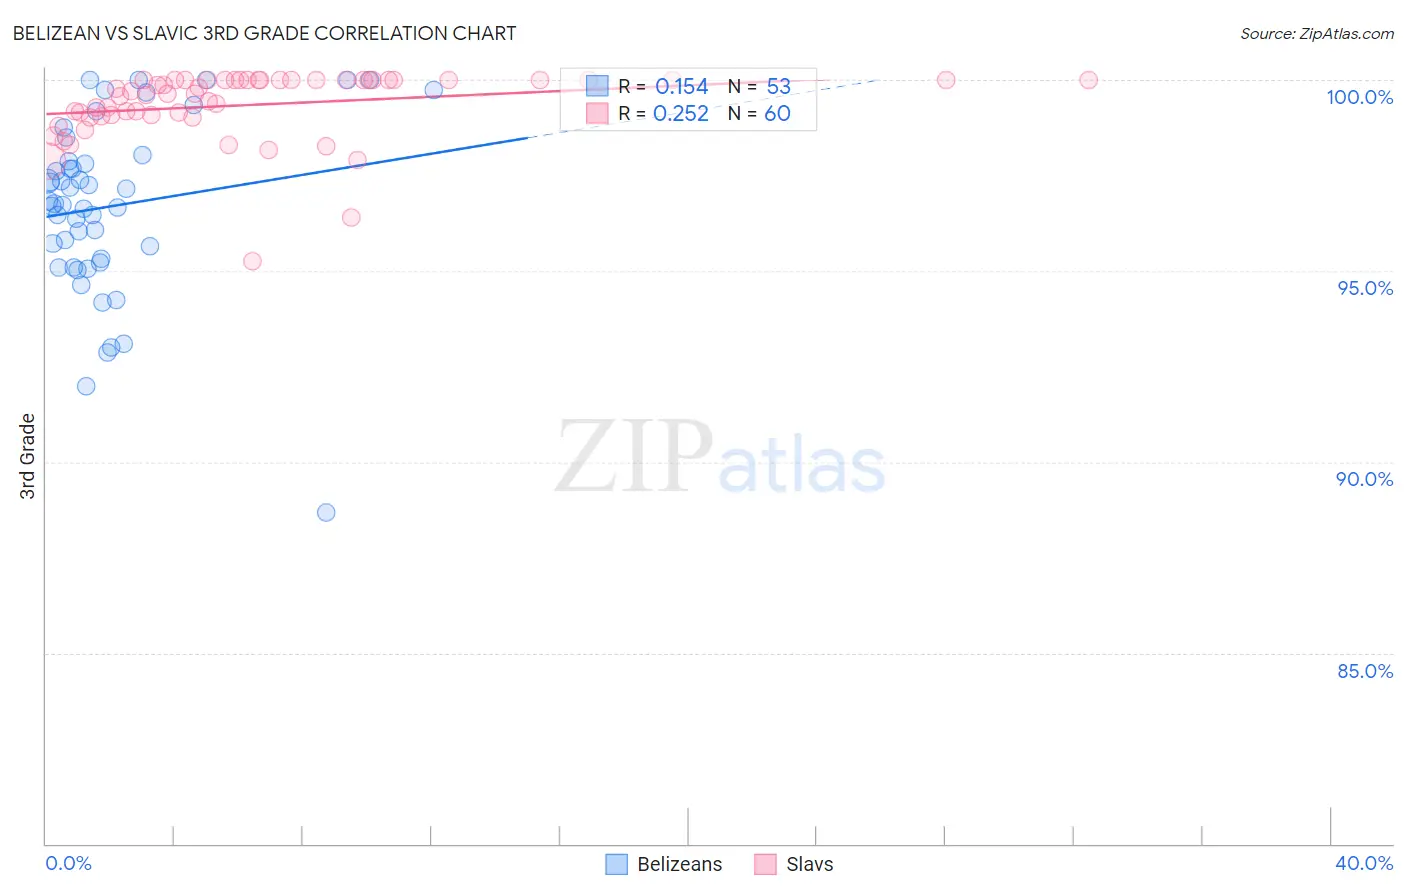
Belizean vs Slavic 3rd Grade Correlation Chart
The statistical analysis conducted on geographies consisting of 144,224,236 people shows a poor positive correlation between the proportion of Belizeans and percentage of population with at least 3rd grade education in the United States with a correlation coefficient (R) of 0.154 and weighted average of 96.6%. Similarly, the statistical analysis conducted on geographies consisting of 270,869,056 people shows a weak positive correlation between the proportion of Slavs and percentage of population with at least 3rd grade education in the United States with a correlation coefficient (R) of 0.252 and weighted average of 98.3%, a difference of 1.7%.
3rd Grade Correlation Summary
| Measurement | Belizean | Slavic |
| Minimum | 88.7% | 95.3% |
| Maximum | 100.0% | 100.0% |
| Range | 11.3% | 4.7% |
| Mean | 96.7% | 99.3% |
| Median | 96.8% | 99.7% |
| Interquartile 25% (IQ1) | 95.3% | 99.1% |
| Interquartile 75% (IQ3) | 98.0% | 100.0% |
| Interquartile Range (IQR) | 2.7% | 0.93% |
| Standard Deviation (Sample) | 2.3% | 0.91% |
| Standard Deviation (Population) | 2.3% | 0.91% |
Similar Demographics by 3rd Grade
Demographics Similar to Belizeans by 3rd Grade
In terms of 3rd grade, the demographic groups most similar to Belizeans are Immigrants from Ecuador (96.6%, a difference of 0.0%), Immigrants from Laos (96.6%, a difference of 0.010%), Immigrants from the Azores (96.6%, a difference of 0.010%), Immigrants from Burma/Myanmar (96.6%, a difference of 0.020%), and Immigrants from Guyana (96.6%, a difference of 0.030%).
| Demographics | Rating | Rank | 3rd Grade |
| Nicaraguans | 0.0 /100 | #307 | Tragic 96.7% |
| Immigrants | Haiti | 0.0 /100 | #308 | Tragic 96.7% |
| Sri Lankans | 0.0 /100 | #309 | Tragic 96.7% |
| Cape Verdeans | 0.0 /100 | #310 | Tragic 96.6% |
| Immigrants | Guyana | 0.0 /100 | #311 | Tragic 96.6% |
| Immigrants | Laos | 0.0 /100 | #312 | Tragic 96.6% |
| Immigrants | Ecuador | 0.0 /100 | #313 | Tragic 96.6% |
| Belizeans | 0.0 /100 | #314 | Tragic 96.6% |
| Immigrants | Azores | 0.0 /100 | #315 | Tragic 96.6% |
| Immigrants | Burma/Myanmar | 0.0 /100 | #316 | Tragic 96.6% |
| Immigrants | Bangladesh | 0.0 /100 | #317 | Tragic 96.6% |
| Hispanics or Latinos | 0.0 /100 | #318 | Tragic 96.5% |
| Vietnamese | 0.0 /100 | #319 | Tragic 96.5% |
| Immigrants | Nicaragua | 0.0 /100 | #320 | Tragic 96.5% |
| Indonesians | 0.0 /100 | #321 | Tragic 96.5% |
Demographics Similar to Slavs by 3rd Grade
In terms of 3rd grade, the demographic groups most similar to Slavs are American (98.3%, a difference of 0.0%), Austrian (98.3%, a difference of 0.0%), Greek (98.3%, a difference of 0.0%), Maltese (98.3%, a difference of 0.0%), and Creek (98.2%, a difference of 0.0%).
| Demographics | Rating | Rank | 3rd Grade |
| Celtics | 99.8 /100 | #50 | Exceptional 98.3% |
| Australians | 99.8 /100 | #51 | Exceptional 98.3% |
| Whites/Caucasians | 99.8 /100 | #52 | Exceptional 98.3% |
| Immigrants | Scotland | 99.8 /100 | #53 | Exceptional 98.3% |
| Bulgarians | 99.8 /100 | #54 | Exceptional 98.3% |
| Americans | 99.8 /100 | #55 | Exceptional 98.3% |
| Austrians | 99.8 /100 | #56 | Exceptional 98.3% |
| Slavs | 99.7 /100 | #57 | Exceptional 98.3% |
| Greeks | 99.7 /100 | #58 | Exceptional 98.3% |
| Maltese | 99.7 /100 | #59 | Exceptional 98.3% |
| Creek | 99.7 /100 | #60 | Exceptional 98.2% |
| Pueblo | 99.7 /100 | #61 | Exceptional 98.2% |
| Immigrants | Canada | 99.7 /100 | #62 | Exceptional 98.2% |
| Immigrants | North America | 99.7 /100 | #63 | Exceptional 98.2% |
| Kiowa | 99.6 /100 | #64 | Exceptional 98.2% |