Jordanian vs Immigrants from Europe Professional Degree
COMPARE
Jordanian
Immigrants from Europe
Professional Degree
Professional Degree Comparison
Jordanians
Immigrants from Europe
4.7%
PROFESSIONAL DEGREE
88.9/ 100
METRIC RATING
137th/ 347
METRIC RANK
5.6%
PROFESSIONAL DEGREE
100.0/ 100
METRIC RATING
59th/ 347
METRIC RANK
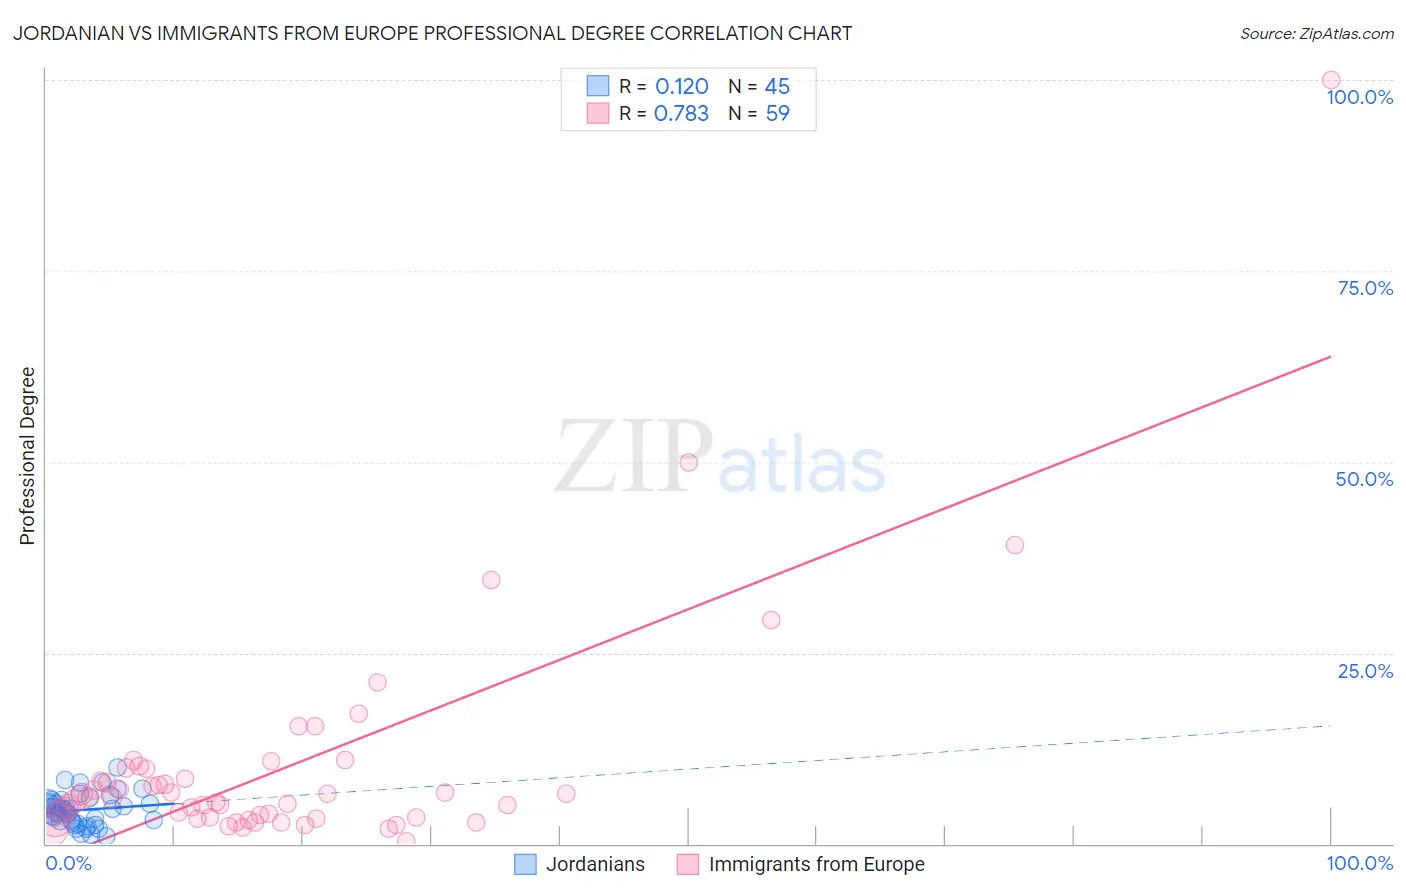
Jordanian vs Immigrants from Europe Professional Degree Correlation Chart
The statistical analysis conducted on geographies consisting of 166,340,382 people shows a poor positive correlation between the proportion of Jordanians and percentage of population with at least professional degree education in the United States with a correlation coefficient (R) of 0.120 and weighted average of 4.7%. Similarly, the statistical analysis conducted on geographies consisting of 543,310,657 people shows a strong positive correlation between the proportion of Immigrants from Europe and percentage of population with at least professional degree education in the United States with a correlation coefficient (R) of 0.783 and weighted average of 5.6%, a difference of 18.9%.
Professional Degree Correlation Summary
| Measurement | Jordanian | Immigrants from Europe |
| Minimum | 1.0% | 0.35% |
| Maximum | 9.9% | 100.0% |
| Range | 8.9% | 99.6% |
| Mean | 4.4% | 10.1% |
| Median | 4.4% | 6.0% |
| Interquartile 25% (IQ1) | 2.9% | 3.3% |
| Interquartile 75% (IQ3) | 5.5% | 9.9% |
| Interquartile Range (IQR) | 2.7% | 6.6% |
| Standard Deviation (Sample) | 2.0% | 15.1% |
| Standard Deviation (Population) | 2.0% | 14.9% |
Similar Demographics by Professional Degree
Demographics Similar to Jordanians by Professional Degree
In terms of professional degree, the demographic groups most similar to Jordanians are Immigrants from Jordan (4.7%, a difference of 0.020%), Afghan (4.7%, a difference of 0.040%), Macedonian (4.8%, a difference of 0.30%), South American Indian (4.8%, a difference of 0.34%), and Italian (4.8%, a difference of 0.46%).
| Demographics | Rating | Rank | Professional Degree |
| Icelanders | 91.5 /100 | #130 | Exceptional 4.8% |
| Immigrants | Nepal | 91.4 /100 | #131 | Exceptional 4.8% |
| Pakistanis | 90.9 /100 | #132 | Exceptional 4.8% |
| Italians | 90.2 /100 | #133 | Exceptional 4.8% |
| South American Indians | 89.9 /100 | #134 | Excellent 4.8% |
| Macedonians | 89.8 /100 | #135 | Excellent 4.8% |
| Immigrants | Jordan | 89.0 /100 | #136 | Excellent 4.7% |
| Jordanians | 88.9 /100 | #137 | Excellent 4.7% |
| Afghans | 88.8 /100 | #138 | Excellent 4.7% |
| South Americans | 85.6 /100 | #139 | Excellent 4.7% |
| Canadians | 84.4 /100 | #140 | Excellent 4.7% |
| Basques | 81.8 /100 | #141 | Excellent 4.6% |
| Sudanese | 81.3 /100 | #142 | Excellent 4.6% |
| Hungarians | 80.8 /100 | #143 | Excellent 4.6% |
| Immigrants | South America | 80.5 /100 | #144 | Excellent 4.6% |
Demographics Similar to Immigrants from Europe by Professional Degree
In terms of professional degree, the demographic groups most similar to Immigrants from Europe are Bolivian (5.6%, a difference of 0.42%), Bulgarian (5.7%, a difference of 0.52%), Immigrants from Lithuania (5.6%, a difference of 1.1%), South African (5.7%, a difference of 1.1%), and Immigrants from Malaysia (5.7%, a difference of 1.4%).
| Demographics | Rating | Rank | Professional Degree |
| Immigrants | Serbia | 100.0 /100 | #52 | Exceptional 5.8% |
| Immigrants | Netherlands | 100.0 /100 | #53 | Exceptional 5.8% |
| Immigrants | Kuwait | 100.0 /100 | #54 | Exceptional 5.7% |
| Immigrants | Western Europe | 100.0 /100 | #55 | Exceptional 5.7% |
| Immigrants | Malaysia | 100.0 /100 | #56 | Exceptional 5.7% |
| South Africans | 100.0 /100 | #57 | Exceptional 5.7% |
| Bulgarians | 100.0 /100 | #58 | Exceptional 5.7% |
| Immigrants | Europe | 100.0 /100 | #59 | Exceptional 5.6% |
| Bolivians | 99.9 /100 | #60 | Exceptional 5.6% |
| Immigrants | Lithuania | 99.9 /100 | #61 | Exceptional 5.6% |
| Immigrants | Belarus | 99.9 /100 | #62 | Exceptional 5.5% |
| Asians | 99.9 /100 | #63 | Exceptional 5.5% |
| Immigrants | Asia | 99.9 /100 | #64 | Exceptional 5.5% |
| Immigrants | Bolivia | 99.9 /100 | #65 | Exceptional 5.5% |
| Immigrants | Kazakhstan | 99.9 /100 | #66 | Exceptional 5.5% |