Jordanian vs Spaniard Professional Degree
COMPARE
Jordanian
Spaniard
Professional Degree
Professional Degree Comparison
Jordanians
Spaniards
4.7%
PROFESSIONAL DEGREE
88.9/ 100
METRIC RATING
137th/ 347
METRIC RANK
4.4%
PROFESSIONAL DEGREE
52.0/ 100
METRIC RATING
172nd/ 347
METRIC RANK
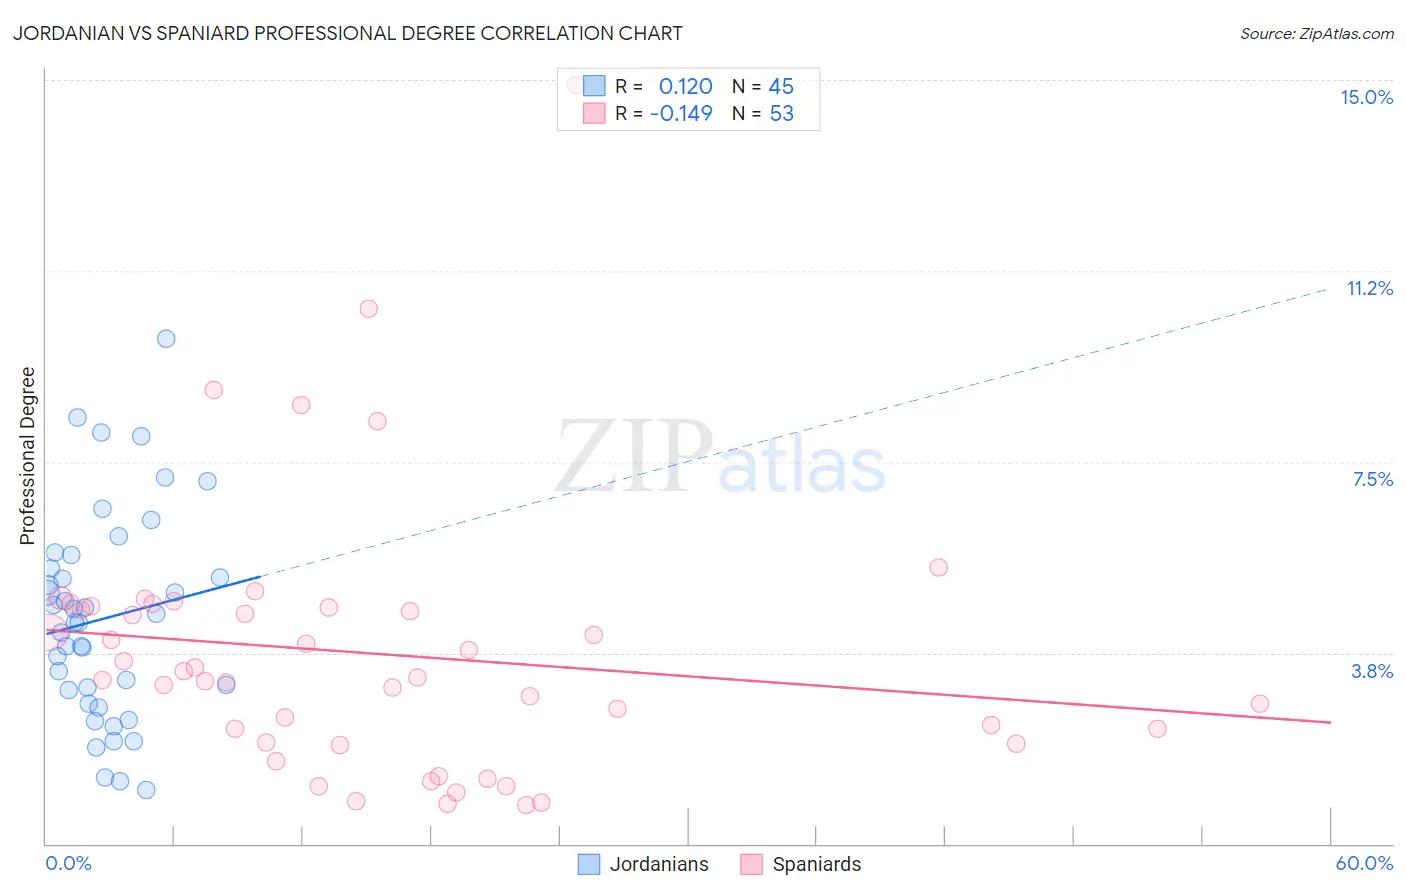
Jordanian vs Spaniard Professional Degree Correlation Chart
The statistical analysis conducted on geographies consisting of 166,340,382 people shows a poor positive correlation between the proportion of Jordanians and percentage of population with at least professional degree education in the United States with a correlation coefficient (R) of 0.120 and weighted average of 4.7%. Similarly, the statistical analysis conducted on geographies consisting of 441,720,376 people shows a poor negative correlation between the proportion of Spaniards and percentage of population with at least professional degree education in the United States with a correlation coefficient (R) of -0.149 and weighted average of 4.4%, a difference of 7.3%.
Professional Degree Correlation Summary
| Measurement | Jordanian | Spaniard |
| Minimum | 1.0% | 0.77% |
| Maximum | 9.9% | 14.9% |
| Range | 8.9% | 14.1% |
| Mean | 4.4% | 3.7% |
| Median | 4.4% | 3.3% |
| Interquartile 25% (IQ1) | 2.9% | 2.0% |
| Interquartile 75% (IQ3) | 5.5% | 4.7% |
| Interquartile Range (IQR) | 2.7% | 2.7% |
| Standard Deviation (Sample) | 2.0% | 2.6% |
| Standard Deviation (Population) | 2.0% | 2.6% |
Similar Demographics by Professional Degree
Demographics Similar to Jordanians by Professional Degree
In terms of professional degree, the demographic groups most similar to Jordanians are Immigrants from Jordan (4.7%, a difference of 0.020%), Afghan (4.7%, a difference of 0.040%), Macedonian (4.8%, a difference of 0.30%), South American Indian (4.8%, a difference of 0.34%), and Italian (4.8%, a difference of 0.46%).
| Demographics | Rating | Rank | Professional Degree |
| Icelanders | 91.5 /100 | #130 | Exceptional 4.8% |
| Immigrants | Nepal | 91.4 /100 | #131 | Exceptional 4.8% |
| Pakistanis | 90.9 /100 | #132 | Exceptional 4.8% |
| Italians | 90.2 /100 | #133 | Exceptional 4.8% |
| South American Indians | 89.9 /100 | #134 | Excellent 4.8% |
| Macedonians | 89.8 /100 | #135 | Excellent 4.8% |
| Immigrants | Jordan | 89.0 /100 | #136 | Excellent 4.7% |
| Jordanians | 88.9 /100 | #137 | Excellent 4.7% |
| Afghans | 88.8 /100 | #138 | Excellent 4.7% |
| South Americans | 85.6 /100 | #139 | Excellent 4.7% |
| Canadians | 84.4 /100 | #140 | Excellent 4.7% |
| Basques | 81.8 /100 | #141 | Excellent 4.6% |
| Sudanese | 81.3 /100 | #142 | Excellent 4.6% |
| Hungarians | 80.8 /100 | #143 | Excellent 4.6% |
| Immigrants | South America | 80.5 /100 | #144 | Excellent 4.6% |
Demographics Similar to Spaniards by Professional Degree
In terms of professional degree, the demographic groups most similar to Spaniards are English (4.4%, a difference of 0.28%), Kenyan (4.4%, a difference of 0.29%), Irish (4.4%, a difference of 0.30%), Immigrants from Peru (4.4%, a difference of 0.39%), and Immigrants from Bangladesh (4.4%, a difference of 0.57%).
| Demographics | Rating | Rank | Professional Degree |
| Costa Ricans | 59.9 /100 | #165 | Average 4.5% |
| Immigrants | Colombia | 59.4 /100 | #166 | Average 4.5% |
| Immigrants | Afghanistan | 59.2 /100 | #167 | Average 4.5% |
| Immigrants | Sierra Leone | 58.7 /100 | #168 | Average 4.5% |
| Chinese | 58.6 /100 | #169 | Average 4.5% |
| Immigrants | Zaire | 57.4 /100 | #170 | Average 4.5% |
| Immigrants | Bangladesh | 56.0 /100 | #171 | Average 4.4% |
| Spaniards | 52.0 /100 | #172 | Average 4.4% |
| English | 50.1 /100 | #173 | Average 4.4% |
| Kenyans | 50.0 /100 | #174 | Average 4.4% |
| Irish | 50.0 /100 | #175 | Average 4.4% |
| Immigrants | Peru | 49.3 /100 | #176 | Average 4.4% |
| Celtics | 47.6 /100 | #177 | Average 4.4% |
| Immigrants | Costa Rica | 46.7 /100 | #178 | Average 4.4% |
| Immigrants | Kenya | 45.9 /100 | #179 | Average 4.4% |