Senegalese vs Immigrants from Lithuania 3rd Grade

COMPARE

Senegalese
Race
Ancestry
AfghanAfricanAlaska NativeAlaskan AthabascanAlbanianAleutAlsatianAmericanApacheArabArapahoArgentineanArmenianAssyrian/Chaldean/SyriacAustralianAustrianBahamianBangladeshiBarbadianBasqueBelgianBelizeanBermudanBhutaneseBlackfeetBolivianBrazilianBritishBritish West IndianBulgarianBurmeseCajunCambodianCanadianCape VerdeanCarpatho RusynCelticCentral AmericanCentral American IndianCherokeeCheyenneChickasawChileanChineseChippewaChoctawColombianColvilleComancheCosta RicanCreeCreekCroatianCrowCubanCypriotCzechCzechoslovakianDanishDelawareDominicanDutchDutch West IndianEastern EuropeanEcuadorianEgyptianEnglishEstonianEthiopianEuropeanFijianFilipinoFinnishFrenchFrench American IndianFrench CanadianGermanGerman RussianGhanaianGreekGuamanian/ChamorroGuatemalanGuyaneseHaitianHmongHonduranHopiHoumaHungarianIcelanderIndian (Asian)IndonesianInupiatIranianIraqiIrishIroquoisIsraeliItalianJamaicanJapaneseJordanianKenyanKiowaKoreanLaotianLatvianLebaneseLiberianLithuanianLumbeeLuxembourgerMacedonianMalaysianMalteseMarshalleseMenomineeMexicanMexican American IndianMongolianMoroccanNative HawaiianNavajoNepaleseNew ZealanderNicaraguanNigerianNorthern EuropeanNorwegianOkinawanOsageOttawaPaiutePakistaniPalestinianPanamanianParaguayanPennsylvania GermanPeruvianPimaPolishPortuguesePotawatomiPuebloPuerto RicanPuget Sound SalishRomanianRussianSalvadoranSamoanScandinavianScotch-IrishScottishSeminoleSenegaleseSerbianShoshoneSierra LeoneanSiouxSlavicSlovakSloveneSomaliSouth AfricanSouth AmericanSouth American IndianSoviet UnionSpaniardSpanishSpanish AmericanSpanish American IndianSri LankanSubsaharan AfricanSudaneseSwedishSwissSyrianTaiwaneseThaiTlingit-HaidaTohono O'OdhamTonganTrinidadian and TobagonianTsimshianTurkishU.S. Virgin IslanderUgandanUkrainianUruguayanUteVenezuelanVietnameseWelshWest IndianYakamaYaquiYugoslavianYumanYup'ikZimbabwean
Immigration
NonimmigrantsImmigrantsAfghanistanAfricaAlbaniaArgentinaArmeniaAsiaAustraliaAustriaBahamasBangladeshBarbadosBelarusBelgiumBelizeBoliviaBosnia and HerzegovinaBrazilBulgariaBurma/MyanmarCabo VerdeCambodiaCameroonCanadaCaribbeanCentral AmericaChileChinaColombiaCongoCosta RicaCroatiaCubaCzechoslovakiaDenmarkDominicaDominican RepublicEastern AfricaEastern AsiaEastern EuropeEcuadorEgyptEl SalvadorEnglandEritreaEthiopiaEuropeFijiFranceGermanyGhanaGreeceGrenadaGuatemalaGuyanaHaitiHondurasHong KongHungaryIndiaIndonesiaIranIraqIrelandIsraelItalyJamaicaJapanJordanKazakhstanKenyaKoreaKuwaitLaosLatin AmericaLatviaLebanonLiberiaMalaysiaMexicoMicronesiaMiddle AfricaMoldovaMoroccoNepalNetherlandsNicaraguaNigeriaNorth AmericaNorth MacedoniaNorthern AfricaNorthern EuropeNorwayOceaniaPakistanPanamaPeruPhilippinesPolandPortugalRomaniaRussiaSaudi ArabiaScotlandSenegalSerbiaSierra LeoneSingaporeSomaliaSouth AfricaSouth AmericaSouth Central AsiaSouth Eastern AsiaSouthern EuropeSpainSri LankaSt. Vincent and the GrenadinesSudanSwedenSwitzerlandSyriaTaiwanThailandTrinidad and TobagoTurkeyUgandaUkraineUruguayUzbekistanVenezuelaVietnamWest IndiesWestern AfricaWestern AsiaWestern EuropeYemenZaireZimbabweAzores
Immigrants from Lithuania
Race
Ancestry
AfghanAfricanAlaska NativeAlaskan AthabascanAlbanianAleutAlsatianAmericanApacheArabArapahoArgentineanArmenianAssyrian/Chaldean/SyriacAustralianAustrianBahamianBangladeshiBarbadianBasqueBelgianBelizeanBermudanBhutaneseBlackfeetBolivianBrazilianBritishBritish West IndianBulgarianBurmeseCajunCambodianCanadianCape VerdeanCarpatho RusynCelticCentral AmericanCentral American IndianCherokeeCheyenneChickasawChileanChineseChippewaChoctawColombianColvilleComancheCosta RicanCreeCreekCroatianCrowCubanCypriotCzechCzechoslovakianDanishDelawareDominicanDutchDutch West IndianEastern EuropeanEcuadorianEgyptianEnglishEstonianEthiopianEuropeanFijianFilipinoFinnishFrenchFrench American IndianFrench CanadianGermanGerman RussianGhanaianGreekGuamanian/ChamorroGuatemalanGuyaneseHaitianHmongHonduranHopiHoumaHungarianIcelanderIndian (Asian)IndonesianInupiatIranianIraqiIrishIroquoisIsraeliItalianJamaicanJapaneseJordanianKenyanKiowaKoreanLaotianLatvianLebaneseLiberianLithuanianLumbeeLuxembourgerMacedonianMalaysianMalteseMarshalleseMenomineeMexicanMexican American IndianMongolianMoroccanNative HawaiianNavajoNepaleseNew ZealanderNicaraguanNigerianNorthern EuropeanNorwegianOkinawanOsageOttawaPaiutePakistaniPalestinianPanamanianParaguayanPennsylvania GermanPeruvianPimaPolishPortuguesePotawatomiPuebloPuerto RicanPuget Sound SalishRomanianRussianSalvadoranSamoanScandinavianScotch-IrishScottishSeminoleSerbianShoshoneSierra LeoneanSiouxSlavicSlovakSloveneSomaliSouth AfricanSouth AmericanSouth American IndianSoviet UnionSpaniardSpanishSpanish AmericanSpanish American IndianSri LankanSubsaharan AfricanSudaneseSwedishSwissSyrianTaiwaneseThaiTlingit-HaidaTohono O'OdhamTonganTrinidadian and TobagonianTsimshianTurkishU.S. Virgin IslanderUgandanUkrainianUruguayanUteVenezuelanVietnameseWelshWest IndianYakamaYaquiYugoslavianYumanYup'ikZimbabwean
Immigration
NonimmigrantsImmigrantsAfghanistanAfricaAlbaniaArgentinaArmeniaAsiaAustraliaAustriaBahamasBangladeshBarbadosBelarusBelgiumBelizeBoliviaBosnia and HerzegovinaBrazilBulgariaBurma/MyanmarCabo VerdeCambodiaCameroonCanadaCaribbeanCentral AmericaChileChinaColombiaCongoCosta RicaCroatiaCubaCzechoslovakiaDenmarkDominicaDominican RepublicEastern AfricaEastern AsiaEastern EuropeEcuadorEgyptEl SalvadorEnglandEritreaEthiopiaEuropeFijiFranceGermanyGhanaGreeceGrenadaGuatemalaGuyanaHaitiHondurasHong KongHungaryIndiaIndonesiaIranIraqIrelandIsraelItalyJamaicaJapanJordanKazakhstanKenyaKoreaKuwaitLaosLatin AmericaLatviaLebanonLiberiaLithuaniaMalaysiaMexicoMicronesiaMiddle AfricaMoldovaMoroccoNepalNetherlandsNicaraguaNigeriaNorth AmericaNorth MacedoniaNorthern AfricaNorthern EuropeNorwayOceaniaPakistanPanamaPeruPhilippinesPolandPortugalRomaniaRussiaSaudi ArabiaScotlandSenegalSerbiaSierra LeoneSingaporeSomaliaSouth AfricaSouth AmericaSouth Central AsiaSouth Eastern AsiaSouthern EuropeSpainSri LankaSt. Vincent and the GrenadinesSudanSwedenSwitzerlandSyriaTaiwanThailandTrinidad and TobagoTurkeyUgandaUkraineUruguayUzbekistanVenezuelaVietnamWest IndiesWestern AfricaWestern AsiaWestern EuropeYemenZaireZimbabweAzores
3rd Grade
Income
Poverty
Unemployment
Labor Participation
Family Structure
Vehicle Availability
Education Level
Disability

3rd Grade Comparison

Senegalese

Immigrants from Lithuania

Tragic
Exceptional
97.5%
3RD GRADE
3.0/ 100
METRIC RATING
229th/ 347
METRIC RANK
98.2%
3RD GRADE
99.2/ 100
METRIC RATING
77th/ 347
METRIC RANK

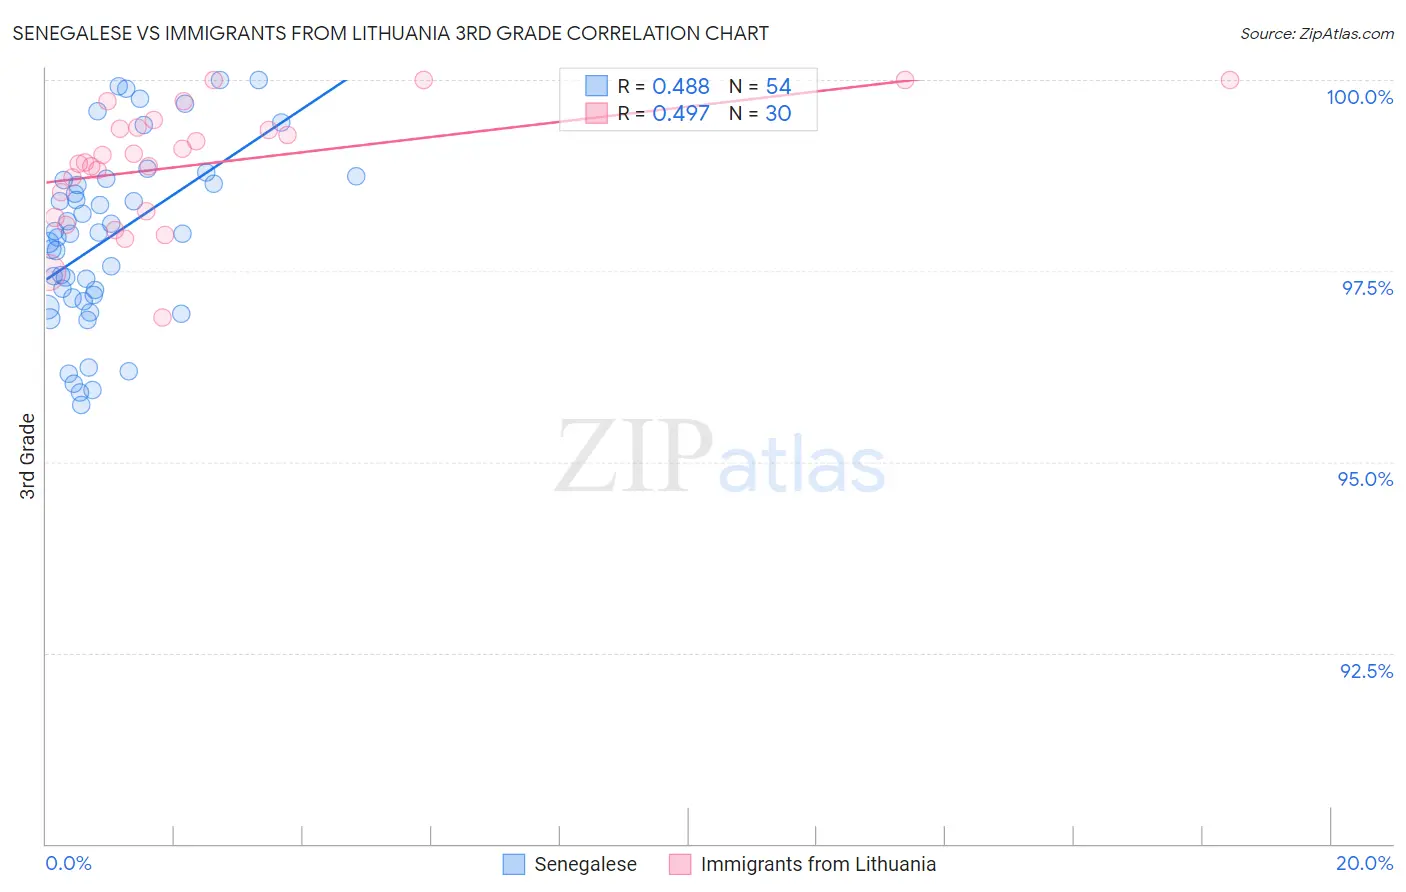
Senegalese vs Immigrants from Lithuania 3rd Grade Correlation Chart

The statistical analysis conducted on geographies consisting of 78,142,569 people shows a moderate positive correlation between the proportion of Senegalese and percentage of population with at least 3rd grade education in the United States with a correlation coefficient (R) of 0.488 and weighted average of 97.5%. Similarly, the statistical analysis conducted on geographies consisting of 117,724,932 people shows a moderate positive correlation between the proportion of Immigrants from Lithuania and percentage of population with at least 3rd grade education in the United States with a correlation coefficient (R) of 0.497 and weighted average of 98.2%, a difference of 0.71%.
Senegalese vs Immigrants from Lithuania 3rd Grade

3rd Grade Correlation Summary

MeasurementSenegaleseImmigrants from Lithuania
Minimum95.7%96.9%
Maximum100.0%100.0%
Range4.3%3.1%
Mean97.9%98.9%
Median98.0%99.0%
Interquartile 25% (IQ1)97.1%98.3%
Interquartile 75% (IQ3)98.7%99.4%
Interquartile Range (IQR)1.6%1.1%
Standard Deviation (Sample)1.2%0.78%
Standard Deviation (Population)1.1%0.77%

Similar Demographics by 3rd Grade

Demographics Similar to Senegalese by 3rd Grade

In terms of 3rd grade, the demographic groups most similar to Senegalese are Immigrants from Sudan (97.5%, a difference of 0.010%), Subsaharan African (97.5%, a difference of 0.010%), Immigrants from Pakistan (97.5%, a difference of 0.010%), Immigrants from Costa Rica (97.5%, a difference of 0.010%), and Immigrants from Western Asia (97.5%, a difference of 0.010%).
DemographicsRating | Rank3rd Grade
Sierra Leoneans
4.6
/100
|
#222
Tragic
97.5%
Immigrants | Syria
4.4
/100
|
#223
Tragic
97.5%
Bahamians
4.4
/100
|
#224
Tragic
97.5%
Tongans
4.3
/100
|
#225
Tragic
97.5%
Sudanese
4.1
/100
|
#226
Tragic
97.5%
Immigrants | Sudan
3.4
/100
|
#227
Tragic
97.5%
Sub-Saharan Africans
3.2
/100
|
#228
Tragic
97.5%
Senegalese
3.0
/100
|
#229
Tragic
97.5%
Immigrants | Pakistan
2.7
/100
|
#230
Tragic
97.5%
Immigrants | Costa Rica
2.7
/100
|
#231
Tragic
97.5%
Immigrants | Western Asia
2.6
/100
|
#232
Tragic
97.5%
Immigrants | Malaysia
2.4
/100
|
#233
Tragic
97.5%
Immigrants | Eastern Asia
1.9
/100
|
#234
Tragic
97.4%
Immigrants | Iraq
1.8
/100
|
#235
Tragic
97.4%
Liberians
1.8
/100
|
#236
Tragic
97.4%

Demographics Similar to Immigrants from Lithuania by 3rd Grade

In terms of 3rd grade, the demographic groups most similar to Immigrants from Lithuania are Immigrants from England (98.2%, a difference of 0.0%), Immigrants from Netherlands (98.2%, a difference of 0.010%), Cherokee (98.2%, a difference of 0.010%), Osage (98.2%, a difference of 0.010%), and Immigrants from Belgium (98.1%, a difference of 0.010%).
DemographicsRating | Rank3rd Grade
Cajuns
99.6
/100
|
#70
Exceptional
98.2%
Immigrants | Austria
99.6
/100
|
#71
Exceptional
98.2%
Chickasaw
99.5
/100
|
#72
Exceptional
98.2%
Cheyenne
99.3
/100
|
#73
Exceptional
98.2%
Immigrants | Netherlands
99.3
/100
|
#74
Exceptional
98.2%
Cherokee
99.3
/100
|
#75
Exceptional
98.2%
Immigrants | England
99.2
/100
|
#76
Exceptional
98.2%
Immigrants | Lithuania
99.2
/100
|
#77
Exceptional
98.2%
Osage
99.2
/100
|
#78
Exceptional
98.2%
Immigrants | Belgium
99.1
/100
|
#79
Exceptional
98.1%
Macedonians
99.1
/100
|
#80
Exceptional
98.1%
Icelanders
99.1
/100
|
#81
Exceptional
98.1%
Shoshone
99.0
/100
|
#82
Exceptional
98.1%
Ukrainians
98.9
/100
|
#83
Exceptional
98.1%
Immigrants | Sweden
98.9
/100
|
#84
Exceptional
98.1%