Immigrants from England vs Immigrants from Dominican Republic High School Diploma
COMPARE
Immigrants from England
Immigrants from Dominican Republic
High School Diploma
High School Diploma Comparison
Immigrants from England
Immigrants from Dominican Republic
90.8%
HIGH SCHOOL DIPLOMA
99.3/ 100
METRIC RATING
80th/ 347
METRIC RANK
82.0%
HIGH SCHOOL DIPLOMA
0.0/ 100
METRIC RATING
336th/ 347
METRIC RANK
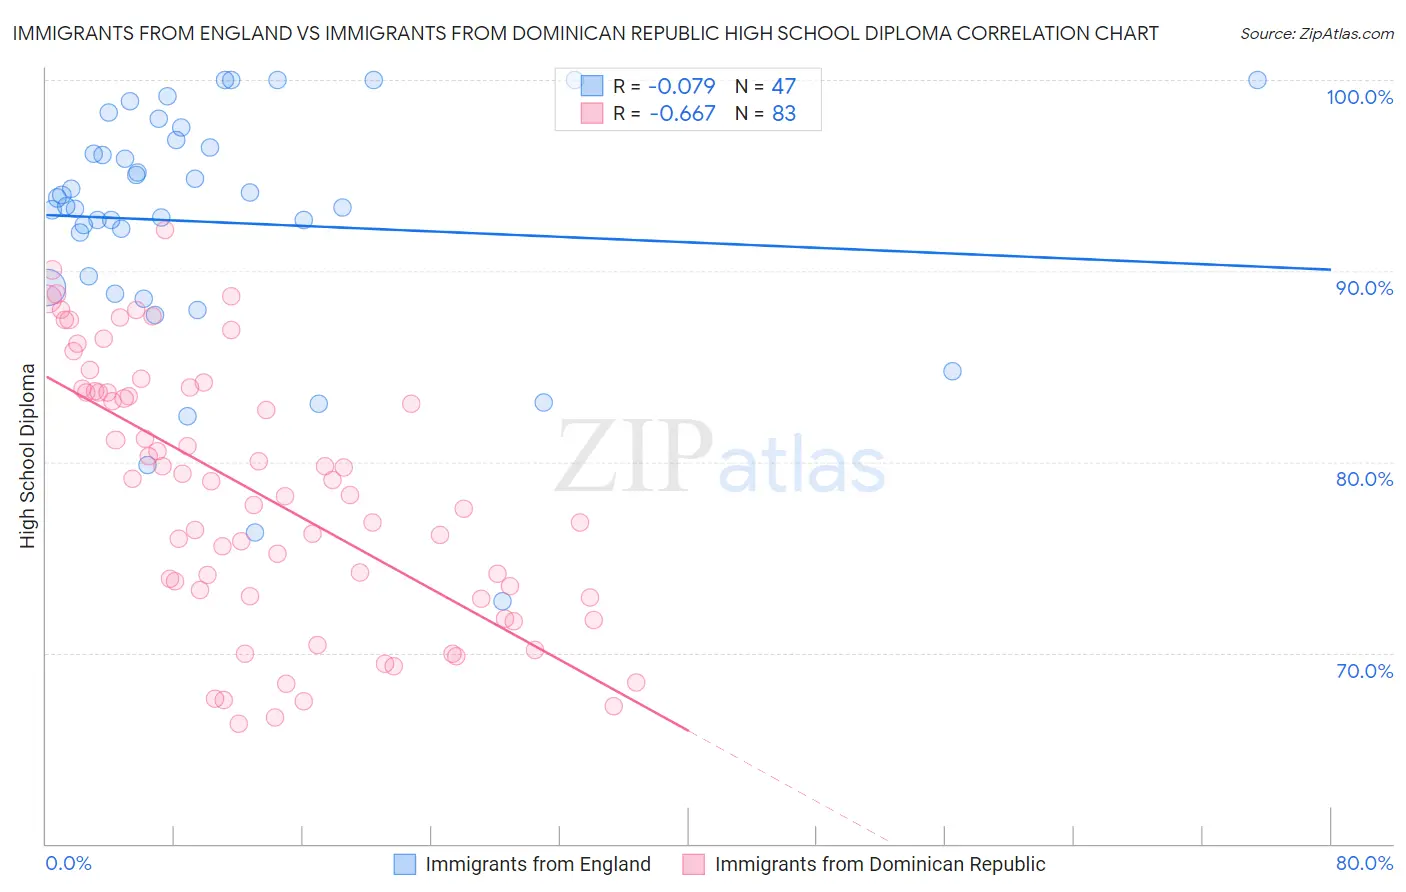
Immigrants from England vs Immigrants from Dominican Republic High School Diploma Correlation Chart
The statistical analysis conducted on geographies consisting of 391,897,700 people shows a slight negative correlation between the proportion of Immigrants from England and percentage of population with at least high school diploma education in the United States with a correlation coefficient (R) of -0.079 and weighted average of 90.8%. Similarly, the statistical analysis conducted on geographies consisting of 275,144,349 people shows a significant negative correlation between the proportion of Immigrants from Dominican Republic and percentage of population with at least high school diploma education in the United States with a correlation coefficient (R) of -0.667 and weighted average of 82.0%, a difference of 10.8%.
High School Diploma Correlation Summary
| Measurement | Immigrants from England | Immigrants from Dominican Republic |
| Minimum | 72.7% | 66.3% |
| Maximum | 100.0% | 92.2% |
| Range | 27.3% | 25.9% |
| Mean | 92.5% | 78.4% |
| Median | 93.4% | 79.0% |
| Interquartile 25% (IQ1) | 89.1% | 73.0% |
| Interquartile 75% (IQ3) | 96.9% | 83.7% |
| Interquartile Range (IQR) | 7.8% | 10.8% |
| Standard Deviation (Sample) | 6.4% | 6.8% |
| Standard Deviation (Population) | 6.3% | 6.7% |
Similar Demographics by High School Diploma
Demographics Similar to Immigrants from England by High School Diploma
In terms of high school diploma, the demographic groups most similar to Immigrants from England are Immigrants from Switzerland (90.8%, a difference of 0.0%), Immigrants from Denmark (90.8%, a difference of 0.010%), Native Hawaiian (90.8%, a difference of 0.020%), Burmese (90.8%, a difference of 0.020%), and Hungarian (90.8%, a difference of 0.030%).
| Demographics | Rating | Rank | High School Diploma |
| Immigrants | South Central Asia | 99.4 /100 | #73 | Exceptional 90.9% |
| Immigrants | Czechoslovakia | 99.4 /100 | #74 | Exceptional 90.9% |
| Cambodians | 99.4 /100 | #75 | Exceptional 90.8% |
| Hungarians | 99.3 /100 | #76 | Exceptional 90.8% |
| Native Hawaiians | 99.3 /100 | #77 | Exceptional 90.8% |
| Burmese | 99.3 /100 | #78 | Exceptional 90.8% |
| Immigrants | Denmark | 99.3 /100 | #79 | Exceptional 90.8% |
| Immigrants | England | 99.3 /100 | #80 | Exceptional 90.8% |
| Immigrants | Switzerland | 99.3 /100 | #81 | Exceptional 90.8% |
| Scotch-Irish | 99.2 /100 | #82 | Exceptional 90.8% |
| Immigrants | Moldova | 99.2 /100 | #83 | Exceptional 90.7% |
| Immigrants | Saudi Arabia | 99.1 /100 | #84 | Exceptional 90.7% |
| Romanians | 98.9 /100 | #85 | Exceptional 90.7% |
| Immigrants | Bulgaria | 98.9 /100 | #86 | Exceptional 90.6% |
| Immigrants | Turkey | 98.9 /100 | #87 | Exceptional 90.6% |
Demographics Similar to Immigrants from Dominican Republic by High School Diploma
In terms of high school diploma, the demographic groups most similar to Immigrants from Dominican Republic are Guatemalan (82.0%, a difference of 0.010%), Tohono O'odham (82.1%, a difference of 0.12%), Immigrants from Yemen (81.8%, a difference of 0.15%), Immigrants from Latin America (82.1%, a difference of 0.23%), and Salvadoran (81.7%, a difference of 0.32%).
| Demographics | Rating | Rank | High School Diploma |
| Hispanics or Latinos | 0.0 /100 | #329 | Tragic 82.9% |
| Immigrants | Azores | 0.0 /100 | #330 | Tragic 82.8% |
| Central Americans | 0.0 /100 | #331 | Tragic 82.5% |
| Immigrants | Honduras | 0.0 /100 | #332 | Tragic 82.5% |
| Immigrants | Latin America | 0.0 /100 | #333 | Tragic 82.1% |
| Tohono O'odham | 0.0 /100 | #334 | Tragic 82.1% |
| Guatemalans | 0.0 /100 | #335 | Tragic 82.0% |
| Immigrants | Dominican Republic | 0.0 /100 | #336 | Tragic 82.0% |
| Immigrants | Yemen | 0.0 /100 | #337 | Tragic 81.8% |
| Salvadorans | 0.0 /100 | #338 | Tragic 81.7% |
| Pima | 0.0 /100 | #339 | Tragic 81.6% |
| Houma | 0.0 /100 | #340 | Tragic 81.5% |
| Mexicans | 0.0 /100 | #341 | Tragic 81.4% |
| Immigrants | Guatemala | 0.0 /100 | #342 | Tragic 81.4% |
| Immigrants | El Salvador | 0.0 /100 | #343 | Tragic 80.8% |