Immigrants from Europe vs Korean Master's Degree
COMPARE
Immigrants from Europe
Korean
Master's Degree
Master's Degree Comparison
Immigrants from Europe
Koreans
18.2%
MASTER'S DEGREE
99.9/ 100
METRIC RATING
61st/ 347
METRIC RANK
14.0%
MASTER'S DEGREE
12.7/ 100
METRIC RATING
221st/ 347
METRIC RANK
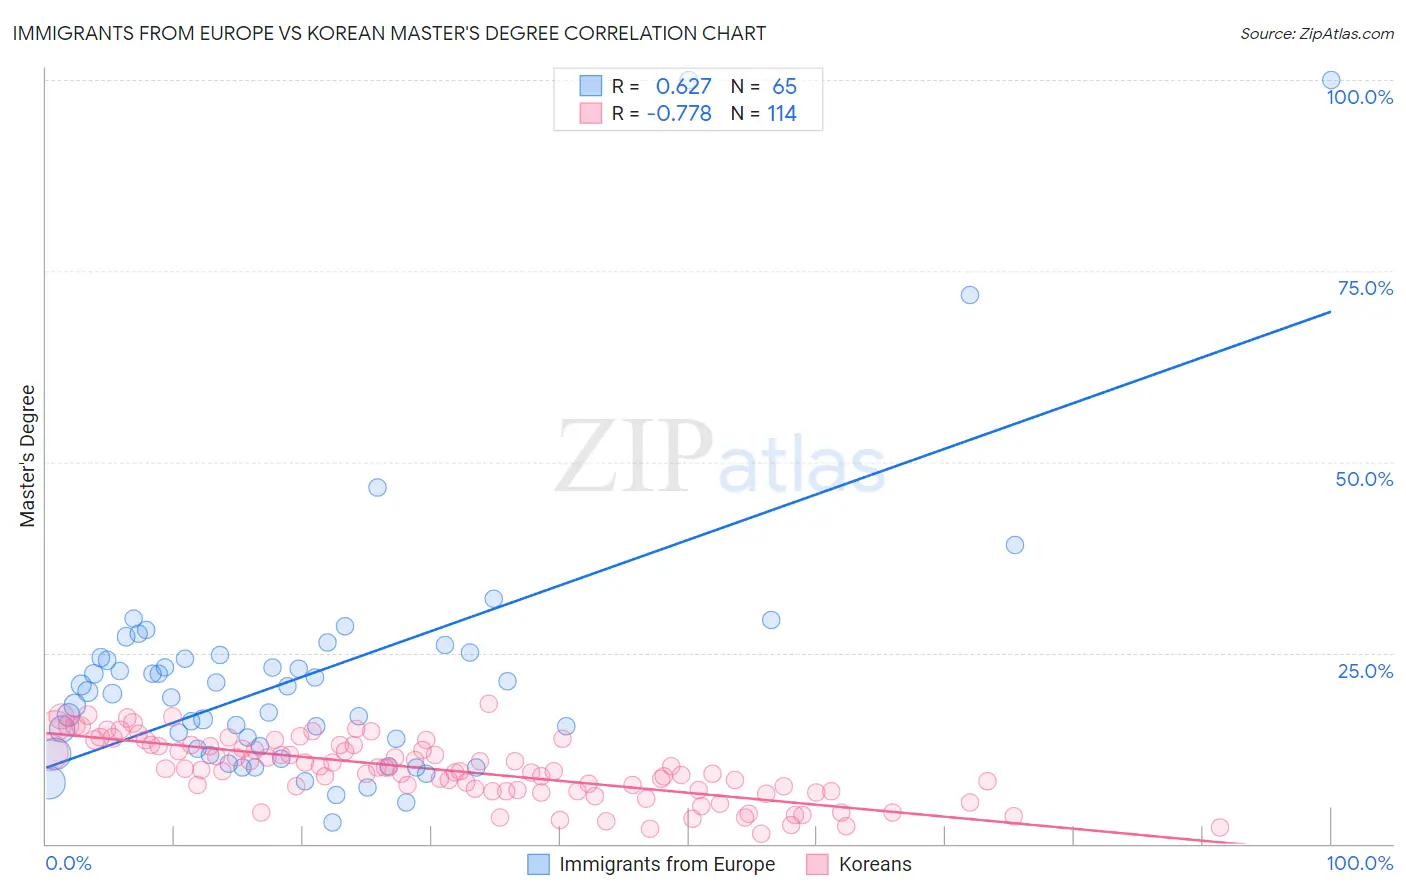
Immigrants from Europe vs Korean Master's Degree Correlation Chart
The statistical analysis conducted on geographies consisting of 547,023,037 people shows a significant positive correlation between the proportion of Immigrants from Europe and percentage of population with at least master's degree education in the United States with a correlation coefficient (R) of 0.627 and weighted average of 18.2%. Similarly, the statistical analysis conducted on geographies consisting of 510,607,877 people shows a strong negative correlation between the proportion of Koreans and percentage of population with at least master's degree education in the United States with a correlation coefficient (R) of -0.778 and weighted average of 14.0%, a difference of 30.3%.
Master's Degree Correlation Summary
| Measurement | Immigrants from Europe | Korean |
| Minimum | 2.7% | 1.4% |
| Maximum | 100.0% | 18.3% |
| Range | 97.3% | 16.9% |
| Mean | 22.0% | 9.7% |
| Median | 19.6% | 9.8% |
| Interquartile 25% (IQ1) | 12.1% | 6.9% |
| Interquartile 75% (IQ3) | 24.5% | 12.9% |
| Interquartile Range (IQR) | 12.5% | 6.0% |
| Standard Deviation (Sample) | 17.5% | 4.0% |
| Standard Deviation (Population) | 17.3% | 4.0% |
Similar Demographics by Master's Degree
Demographics Similar to Immigrants from Europe by Master's Degree
In terms of master's degree, the demographic groups most similar to Immigrants from Europe are New Zealander (18.3%, a difference of 0.15%), Argentinean (18.2%, a difference of 0.36%), Immigrants from Bulgaria (18.3%, a difference of 0.38%), Immigrants from Netherlands (18.1%, a difference of 0.72%), and South African (18.1%, a difference of 0.80%).
| Demographics | Rating | Rank | Master's Degree |
| Immigrants | Lithuania | 99.9 /100 | #54 | Exceptional 18.5% |
| Immigrants | Serbia | 99.9 /100 | #55 | Exceptional 18.5% |
| Asians | 99.9 /100 | #56 | Exceptional 18.4% |
| Immigrants | Asia | 99.9 /100 | #57 | Exceptional 18.4% |
| Australians | 99.9 /100 | #58 | Exceptional 18.4% |
| Immigrants | Bulgaria | 99.9 /100 | #59 | Exceptional 18.3% |
| New Zealanders | 99.9 /100 | #60 | Exceptional 18.3% |
| Immigrants | Europe | 99.9 /100 | #61 | Exceptional 18.2% |
| Argentineans | 99.9 /100 | #62 | Exceptional 18.2% |
| Immigrants | Netherlands | 99.9 /100 | #63 | Exceptional 18.1% |
| South Africans | 99.9 /100 | #64 | Exceptional 18.1% |
| Immigrants | Kazakhstan | 99.8 /100 | #65 | Exceptional 18.0% |
| Ethiopians | 99.8 /100 | #66 | Exceptional 18.0% |
| Immigrants | Argentina | 99.8 /100 | #67 | Exceptional 18.0% |
| Immigrants | Ethiopia | 99.8 /100 | #68 | Exceptional 17.9% |
Demographics Similar to Koreans by Master's Degree
In terms of master's degree, the demographic groups most similar to Koreans are Ecuadorian (14.0%, a difference of 0.030%), German (14.0%, a difference of 0.13%), Immigrants from South Eastern Asia (14.0%, a difference of 0.23%), Immigrants from Grenada (14.0%, a difference of 0.28%), and Norwegian (14.0%, a difference of 0.29%).
| Demographics | Rating | Rank | Master's Degree |
| Finns | 16.9 /100 | #214 | Poor 14.2% |
| Immigrants | Vietnam | 16.1 /100 | #215 | Poor 14.1% |
| Immigrants | Somalia | 15.8 /100 | #216 | Poor 14.1% |
| Immigrants | Trinidad and Tobago | 15.8 /100 | #217 | Poor 14.1% |
| French Canadians | 14.9 /100 | #218 | Poor 14.1% |
| Norwegians | 13.6 /100 | #219 | Poor 14.0% |
| Germans | 13.1 /100 | #220 | Poor 14.0% |
| Koreans | 12.7 /100 | #221 | Poor 14.0% |
| Ecuadorians | 12.6 /100 | #222 | Poor 14.0% |
| Immigrants | South Eastern Asia | 11.9 /100 | #223 | Poor 14.0% |
| Immigrants | Grenada | 11.8 /100 | #224 | Poor 14.0% |
| Portuguese | 11.2 /100 | #225 | Poor 13.9% |
| Immigrants | St. Vincent and the Grenadines | 11.0 /100 | #226 | Poor 13.9% |
| Immigrants | West Indies | 9.8 /100 | #227 | Tragic 13.9% |
| Whites/Caucasians | 9.1 /100 | #228 | Tragic 13.8% |