Immigrants from Laos vs Korean Master's Degree
COMPARE
Immigrants from Laos
Korean
Master's Degree
Master's Degree Comparison
Immigrants from Laos
Koreans
11.4%
MASTER'S DEGREE
0.1/ 100
METRIC RATING
303rd/ 347
METRIC RANK
14.0%
MASTER'S DEGREE
12.7/ 100
METRIC RATING
221st/ 347
METRIC RANK
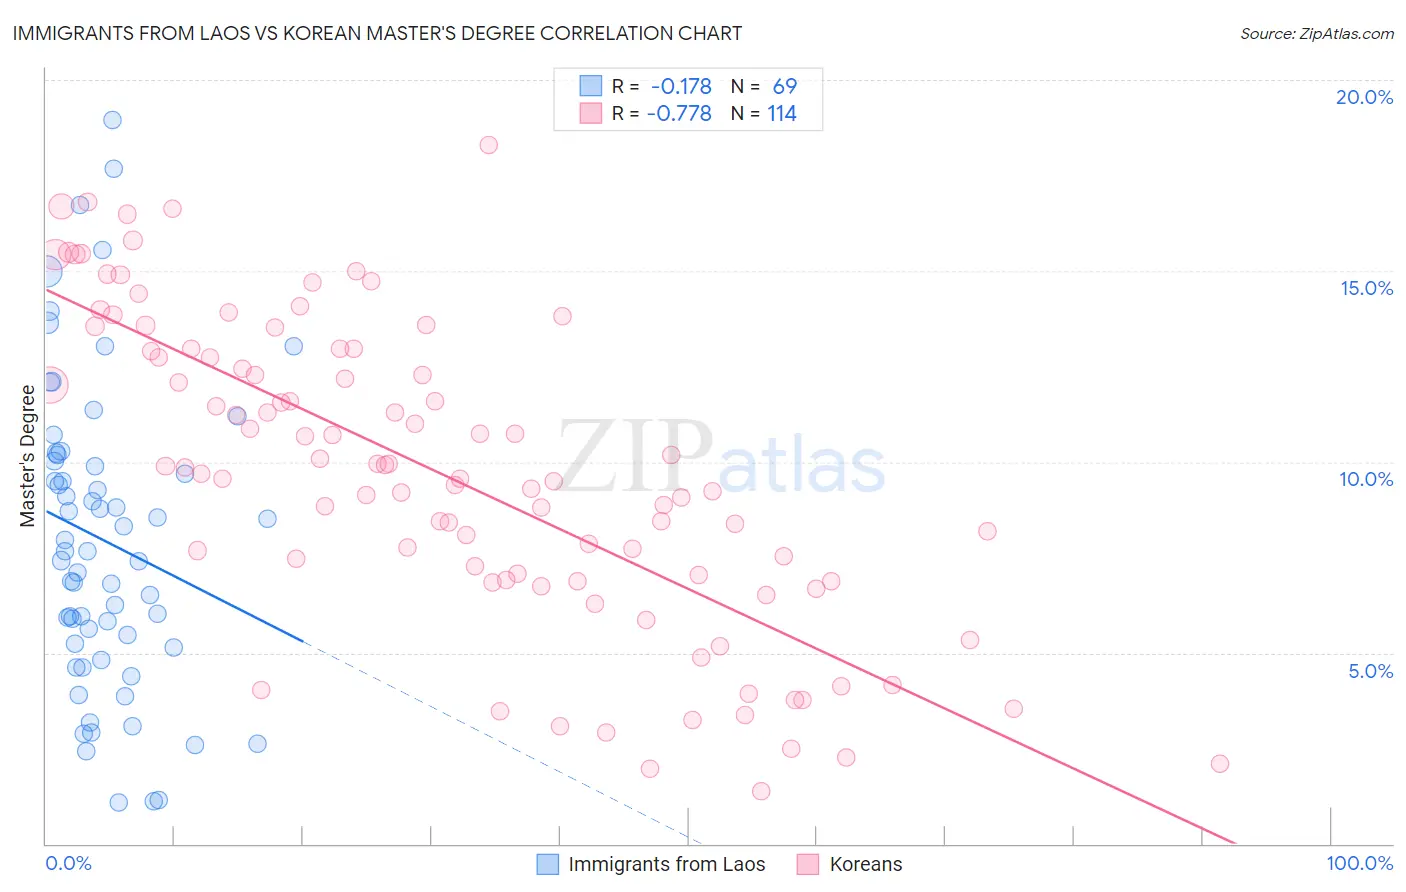
Immigrants from Laos vs Korean Master's Degree Correlation Chart
The statistical analysis conducted on geographies consisting of 201,443,895 people shows a poor negative correlation between the proportion of Immigrants from Laos and percentage of population with at least master's degree education in the United States with a correlation coefficient (R) of -0.178 and weighted average of 11.4%. Similarly, the statistical analysis conducted on geographies consisting of 510,607,877 people shows a strong negative correlation between the proportion of Koreans and percentage of population with at least master's degree education in the United States with a correlation coefficient (R) of -0.778 and weighted average of 14.0%, a difference of 23.2%.
Master's Degree Correlation Summary
| Measurement | Immigrants from Laos | Korean |
| Minimum | 1.1% | 1.4% |
| Maximum | 18.9% | 18.3% |
| Range | 17.8% | 16.9% |
| Mean | 7.9% | 9.7% |
| Median | 7.7% | 9.8% |
| Interquartile 25% (IQ1) | 5.2% | 6.9% |
| Interquartile 75% (IQ3) | 10.1% | 12.9% |
| Interquartile Range (IQR) | 4.9% | 6.0% |
| Standard Deviation (Sample) | 4.0% | 4.0% |
| Standard Deviation (Population) | 4.0% | 4.0% |
Similar Demographics by Master's Degree
Demographics Similar to Immigrants from Laos by Master's Degree
In terms of master's degree, the demographic groups most similar to Immigrants from Laos are Cherokee (11.4%, a difference of 0.020%), Immigrants from Cabo Verde (11.3%, a difference of 0.19%), Tsimshian (11.4%, a difference of 0.33%), Chippewa (11.4%, a difference of 0.49%), and Chickasaw (11.4%, a difference of 0.51%).
| Demographics | Rating | Rank | Master's Degree |
| Alaskan Athabascans | 0.1 /100 | #296 | Tragic 11.6% |
| Immigrants | Yemen | 0.1 /100 | #297 | Tragic 11.6% |
| Samoans | 0.1 /100 | #298 | Tragic 11.5% |
| Chickasaw | 0.1 /100 | #299 | Tragic 11.4% |
| Chippewa | 0.1 /100 | #300 | Tragic 11.4% |
| Tsimshian | 0.1 /100 | #301 | Tragic 11.4% |
| Cherokee | 0.1 /100 | #302 | Tragic 11.4% |
| Immigrants | Laos | 0.1 /100 | #303 | Tragic 11.4% |
| Immigrants | Cabo Verde | 0.1 /100 | #304 | Tragic 11.3% |
| Immigrants | Latin America | 0.0 /100 | #305 | Tragic 11.3% |
| Mexican American Indians | 0.0 /100 | #306 | Tragic 11.2% |
| Cheyenne | 0.0 /100 | #307 | Tragic 11.2% |
| Puerto Ricans | 0.0 /100 | #308 | Tragic 11.2% |
| Puget Sound Salish | 0.0 /100 | #309 | Tragic 11.1% |
| Shoshone | 0.0 /100 | #310 | Tragic 11.1% |
Demographics Similar to Koreans by Master's Degree
In terms of master's degree, the demographic groups most similar to Koreans are Ecuadorian (14.0%, a difference of 0.030%), German (14.0%, a difference of 0.13%), Immigrants from South Eastern Asia (14.0%, a difference of 0.23%), Immigrants from Grenada (14.0%, a difference of 0.28%), and Norwegian (14.0%, a difference of 0.29%).
| Demographics | Rating | Rank | Master's Degree |
| Finns | 16.9 /100 | #214 | Poor 14.2% |
| Immigrants | Vietnam | 16.1 /100 | #215 | Poor 14.1% |
| Immigrants | Somalia | 15.8 /100 | #216 | Poor 14.1% |
| Immigrants | Trinidad and Tobago | 15.8 /100 | #217 | Poor 14.1% |
| French Canadians | 14.9 /100 | #218 | Poor 14.1% |
| Norwegians | 13.6 /100 | #219 | Poor 14.0% |
| Germans | 13.1 /100 | #220 | Poor 14.0% |
| Koreans | 12.7 /100 | #221 | Poor 14.0% |
| Ecuadorians | 12.6 /100 | #222 | Poor 14.0% |
| Immigrants | South Eastern Asia | 11.9 /100 | #223 | Poor 14.0% |
| Immigrants | Grenada | 11.8 /100 | #224 | Poor 14.0% |
| Portuguese | 11.2 /100 | #225 | Poor 13.9% |
| Immigrants | St. Vincent and the Grenadines | 11.0 /100 | #226 | Poor 13.9% |
| Immigrants | West Indies | 9.8 /100 | #227 | Tragic 13.9% |
| Whites/Caucasians | 9.1 /100 | #228 | Tragic 13.8% |