Italian vs Immigrants from Western Africa Master's Degree
COMPARE
Italian
Immigrants from Western Africa
Master's Degree
Master's Degree Comparison
Italians
Immigrants from Western Africa
16.4%
MASTER'S DEGREE
95.4/ 100
METRIC RATING
125th/ 347
METRIC RANK
14.4%
MASTER'S DEGREE
24.9/ 100
METRIC RATING
202nd/ 347
METRIC RANK
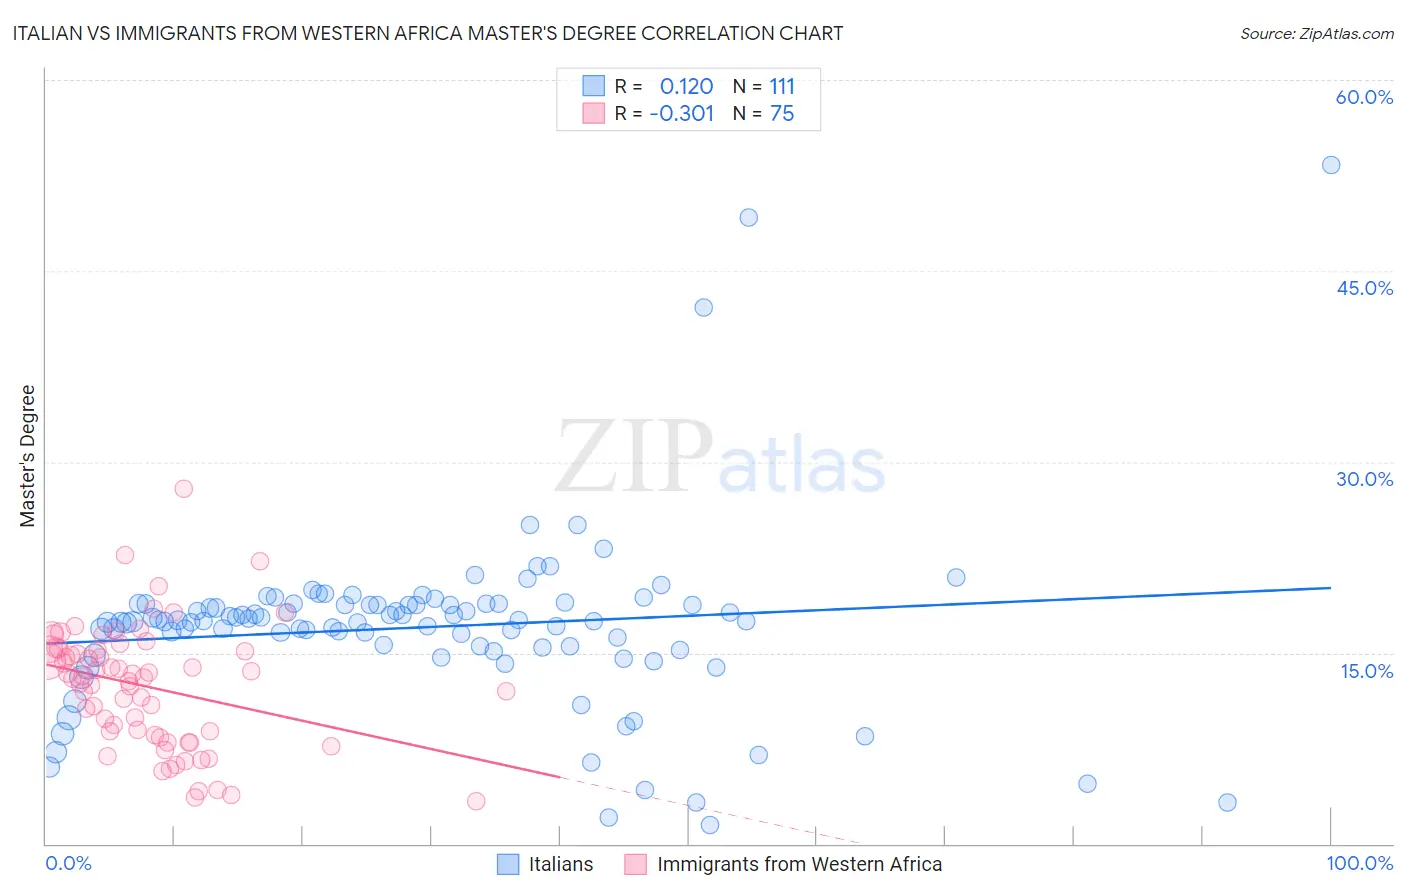
Italian vs Immigrants from Western Africa Master's Degree Correlation Chart
The statistical analysis conducted on geographies consisting of 574,113,330 people shows a poor positive correlation between the proportion of Italians and percentage of population with at least master's degree education in the United States with a correlation coefficient (R) of 0.120 and weighted average of 16.4%. Similarly, the statistical analysis conducted on geographies consisting of 357,742,220 people shows a mild negative correlation between the proportion of Immigrants from Western Africa and percentage of population with at least master's degree education in the United States with a correlation coefficient (R) of -0.301 and weighted average of 14.4%, a difference of 13.7%.
Master's Degree Correlation Summary
| Measurement | Italian | Immigrants from Western Africa |
| Minimum | 1.5% | 3.3% |
| Maximum | 53.3% | 27.9% |
| Range | 51.8% | 24.6% |
| Mean | 17.0% | 12.4% |
| Median | 17.5% | 13.1% |
| Interquartile 25% (IQ1) | 15.4% | 8.5% |
| Interquartile 75% (IQ3) | 18.8% | 15.3% |
| Interquartile Range (IQR) | 3.4% | 6.8% |
| Standard Deviation (Sample) | 7.0% | 4.8% |
| Standard Deviation (Population) | 7.0% | 4.7% |
Similar Demographics by Master's Degree
Demographics Similar to Italians by Master's Degree
In terms of master's degree, the demographic groups most similar to Italians are Immigrants from Eritrea (16.4%, a difference of 0.070%), Immigrants from Eastern Africa (16.3%, a difference of 0.11%), Croatian (16.4%, a difference of 0.14%), British (16.4%, a difference of 0.16%), and Palestinian (16.3%, a difference of 0.37%).
| Demographics | Rating | Rank | Master's Degree |
| Brazilians | 96.8 /100 | #118 | Exceptional 16.5% |
| Jordanians | 96.5 /100 | #119 | Exceptional 16.5% |
| Lebanese | 96.4 /100 | #120 | Exceptional 16.5% |
| Afghans | 96.2 /100 | #121 | Exceptional 16.5% |
| British | 95.6 /100 | #122 | Exceptional 16.4% |
| Croatians | 95.6 /100 | #123 | Exceptional 16.4% |
| Immigrants | Eritrea | 95.5 /100 | #124 | Exceptional 16.4% |
| Italians | 95.4 /100 | #125 | Exceptional 16.4% |
| Immigrants | Eastern Africa | 95.2 /100 | #126 | Exceptional 16.3% |
| Palestinians | 94.8 /100 | #127 | Exceptional 16.3% |
| Immigrants | Sierra Leone | 94.7 /100 | #128 | Exceptional 16.3% |
| Immigrants | Syria | 93.3 /100 | #129 | Exceptional 16.2% |
| Immigrants | Jordan | 92.7 /100 | #130 | Exceptional 16.1% |
| Taiwanese | 91.9 /100 | #131 | Exceptional 16.1% |
| Serbians | 91.7 /100 | #132 | Exceptional 16.1% |
Demographics Similar to Immigrants from Western Africa by Master's Degree
In terms of master's degree, the demographic groups most similar to Immigrants from Western Africa are Scotch-Irish (14.4%, a difference of 0.010%), Panamanian (14.4%, a difference of 0.020%), Yugoslavian (14.4%, a difference of 0.11%), French (14.4%, a difference of 0.22%), and Trinidadian and Tobagonian (14.4%, a difference of 0.26%).
| Demographics | Rating | Rank | Master's Degree |
| Danes | 31.3 /100 | #195 | Fair 14.5% |
| Czechoslovakians | 29.9 /100 | #196 | Fair 14.5% |
| Belgians | 28.0 /100 | #197 | Fair 14.5% |
| West Indians | 27.4 /100 | #198 | Fair 14.5% |
| Immigrants | Armenia | 27.2 /100 | #199 | Fair 14.5% |
| Panamanians | 25.1 /100 | #200 | Fair 14.4% |
| Scotch-Irish | 25.0 /100 | #201 | Fair 14.4% |
| Immigrants | Western Africa | 24.9 /100 | #202 | Fair 14.4% |
| Yugoslavians | 24.3 /100 | #203 | Fair 14.4% |
| French | 23.7 /100 | #204 | Fair 14.4% |
| Trinidadians and Tobagonians | 23.5 /100 | #205 | Fair 14.4% |
| Scandinavians | 23.3 /100 | #206 | Fair 14.4% |
| Immigrants | Bosnia and Herzegovina | 22.0 /100 | #207 | Fair 14.3% |
| Immigrants | Barbados | 20.5 /100 | #208 | Fair 14.3% |
| Immigrants | Panama | 20.0 /100 | #209 | Fair 14.3% |