Japanese vs Immigrants from Belarus Nursery School
COMPARE
Japanese
Immigrants from Belarus
Nursery School
Nursery School Comparison
Japanese
Immigrants from Belarus
96.7%
NURSERY SCHOOL
0.0/ 100
METRIC RATING
330th/ 347
METRIC RANK
98.0%
NURSERY SCHOOL
41.0/ 100
METRIC RATING
185th/ 347
METRIC RANK
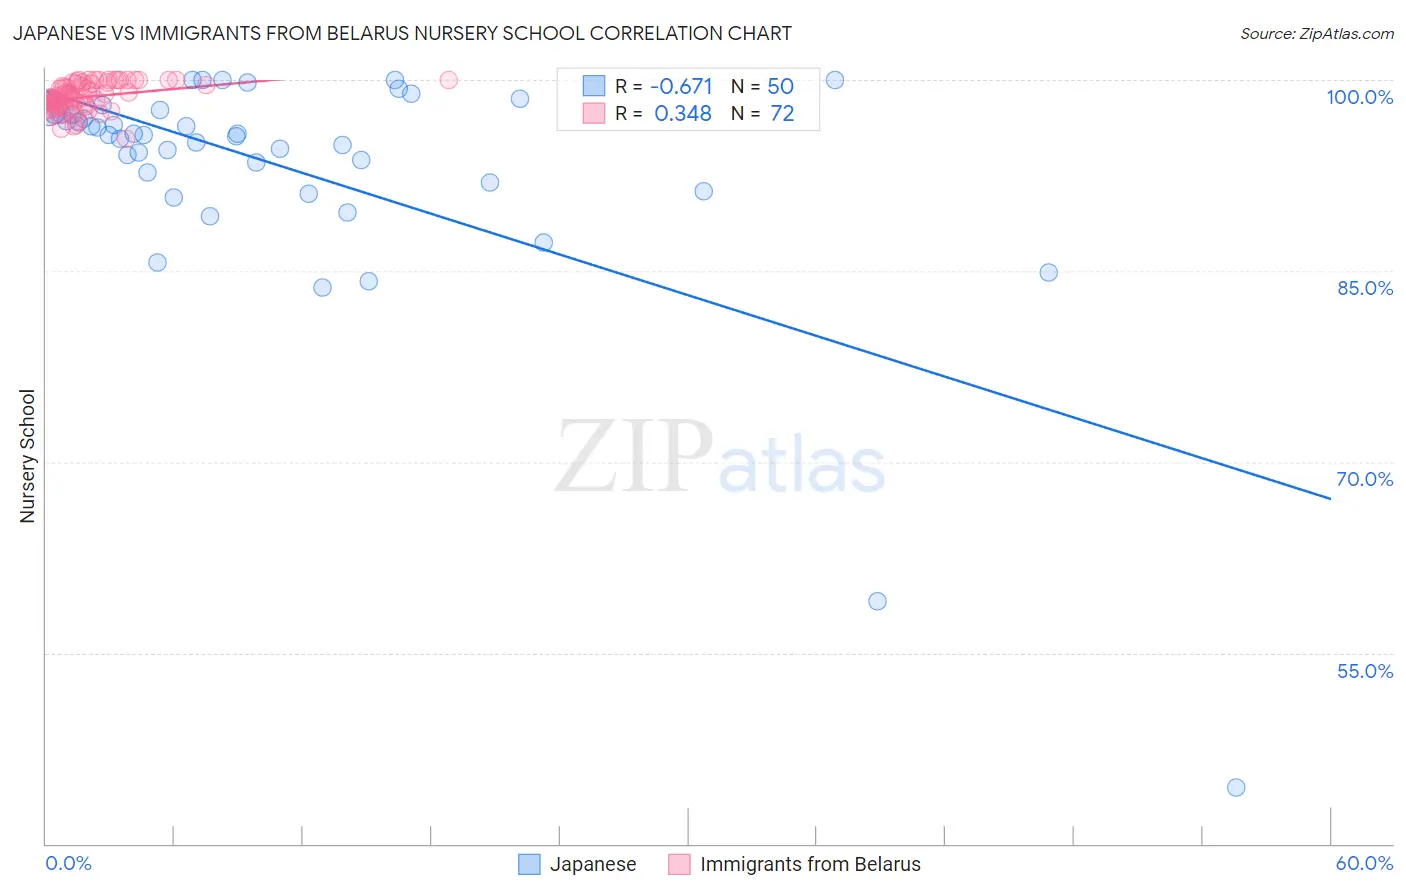
Japanese vs Immigrants from Belarus Nursery School Correlation Chart
The statistical analysis conducted on geographies consisting of 249,183,224 people shows a significant negative correlation between the proportion of Japanese and percentage of population with at least nursery school education in the United States with a correlation coefficient (R) of -0.671 and weighted average of 96.7%. Similarly, the statistical analysis conducted on geographies consisting of 149,993,317 people shows a mild positive correlation between the proportion of Immigrants from Belarus and percentage of population with at least nursery school education in the United States with a correlation coefficient (R) of 0.348 and weighted average of 98.0%, a difference of 1.3%.
Nursery School Correlation Summary
| Measurement | Japanese | Immigrants from Belarus |
| Minimum | 44.4% | 95.4% |
| Maximum | 100.0% | 100.0% |
| Range | 55.6% | 4.6% |
| Mean | 93.0% | 98.7% |
| Median | 95.6% | 98.7% |
| Interquartile 25% (IQ1) | 92.0% | 97.9% |
| Interquartile 75% (IQ3) | 97.4% | 99.7% |
| Interquartile Range (IQR) | 5.4% | 1.8% |
| Standard Deviation (Sample) | 9.6% | 1.1% |
| Standard Deviation (Population) | 9.5% | 1.1% |
Similar Demographics by Nursery School
Demographics Similar to Japanese by Nursery School
In terms of nursery school, the demographic groups most similar to Japanese are Immigrants from Vietnam (96.7%, a difference of 0.010%), Immigrants from Armenia (96.7%, a difference of 0.020%), Yakama (96.6%, a difference of 0.040%), Immigrants from Latin America (96.7%, a difference of 0.060%), and Central American (96.6%, a difference of 0.060%).
| Demographics | Rating | Rank | Nursery School |
| Immigrants | Honduras | 0.0 /100 | #323 | Tragic 96.9% |
| Vietnamese | 0.0 /100 | #324 | Tragic 96.8% |
| Dominicans | 0.0 /100 | #325 | Tragic 96.8% |
| Indonesians | 0.0 /100 | #326 | Tragic 96.8% |
| Mexicans | 0.0 /100 | #327 | Tragic 96.8% |
| Immigrants | Latin America | 0.0 /100 | #328 | Tragic 96.7% |
| Immigrants | Vietnam | 0.0 /100 | #329 | Tragic 96.7% |
| Japanese | 0.0 /100 | #330 | Tragic 96.7% |
| Immigrants | Armenia | 0.0 /100 | #331 | Tragic 96.7% |
| Yakama | 0.0 /100 | #332 | Tragic 96.6% |
| Central Americans | 0.0 /100 | #333 | Tragic 96.6% |
| Immigrants | Dominican Republic | 0.0 /100 | #334 | Tragic 96.6% |
| Bangladeshis | 0.0 /100 | #335 | Tragic 96.6% |
| Guatemalans | 0.0 /100 | #336 | Tragic 96.6% |
| Immigrants | Cambodia | 0.0 /100 | #337 | Tragic 96.5% |
Demographics Similar to Immigrants from Belarus by Nursery School
In terms of nursery school, the demographic groups most similar to Immigrants from Belarus are Paiute (98.0%, a difference of 0.0%), Portuguese (98.0%, a difference of 0.0%), Immigrants from Poland (98.0%, a difference of 0.0%), Immigrants from Argentina (98.0%, a difference of 0.0%), and Immigrants from Bosnia and Herzegovina (98.0%, a difference of 0.010%).
| Demographics | Rating | Rank | Nursery School |
| Natives/Alaskans | 48.6 /100 | #178 | Average 98.0% |
| Argentineans | 46.8 /100 | #179 | Average 98.0% |
| Immigrants | Bosnia and Herzegovina | 45.6 /100 | #180 | Average 98.0% |
| Egyptians | 42.8 /100 | #181 | Average 98.0% |
| Paiute | 42.0 /100 | #182 | Average 98.0% |
| Portuguese | 41.8 /100 | #183 | Average 98.0% |
| Immigrants | Poland | 41.3 /100 | #184 | Average 98.0% |
| Immigrants | Belarus | 41.0 /100 | #185 | Average 98.0% |
| Immigrants | Argentina | 40.8 /100 | #186 | Average 98.0% |
| Immigrants | Kazakhstan | 37.1 /100 | #187 | Fair 97.9% |
| Arabs | 34.7 /100 | #188 | Fair 97.9% |
| Pakistanis | 34.6 /100 | #189 | Fair 97.9% |
| Panamanians | 34.3 /100 | #190 | Fair 97.9% |
| Immigrants | Taiwan | 30.6 /100 | #191 | Fair 97.9% |
| Blacks/African Americans | 29.4 /100 | #192 | Fair 97.9% |