Jamaican vs Thai 3rd Grade
COMPARE
Jamaican
Thai
3rd Grade
3rd Grade Comparison
Jamaicans
Thais
97.4%
3RD GRADE
0.7/ 100
METRIC RATING
254th/ 347
METRIC RANK
98.0%
3RD GRADE
95.5/ 100
METRIC RATING
113th/ 347
METRIC RANK
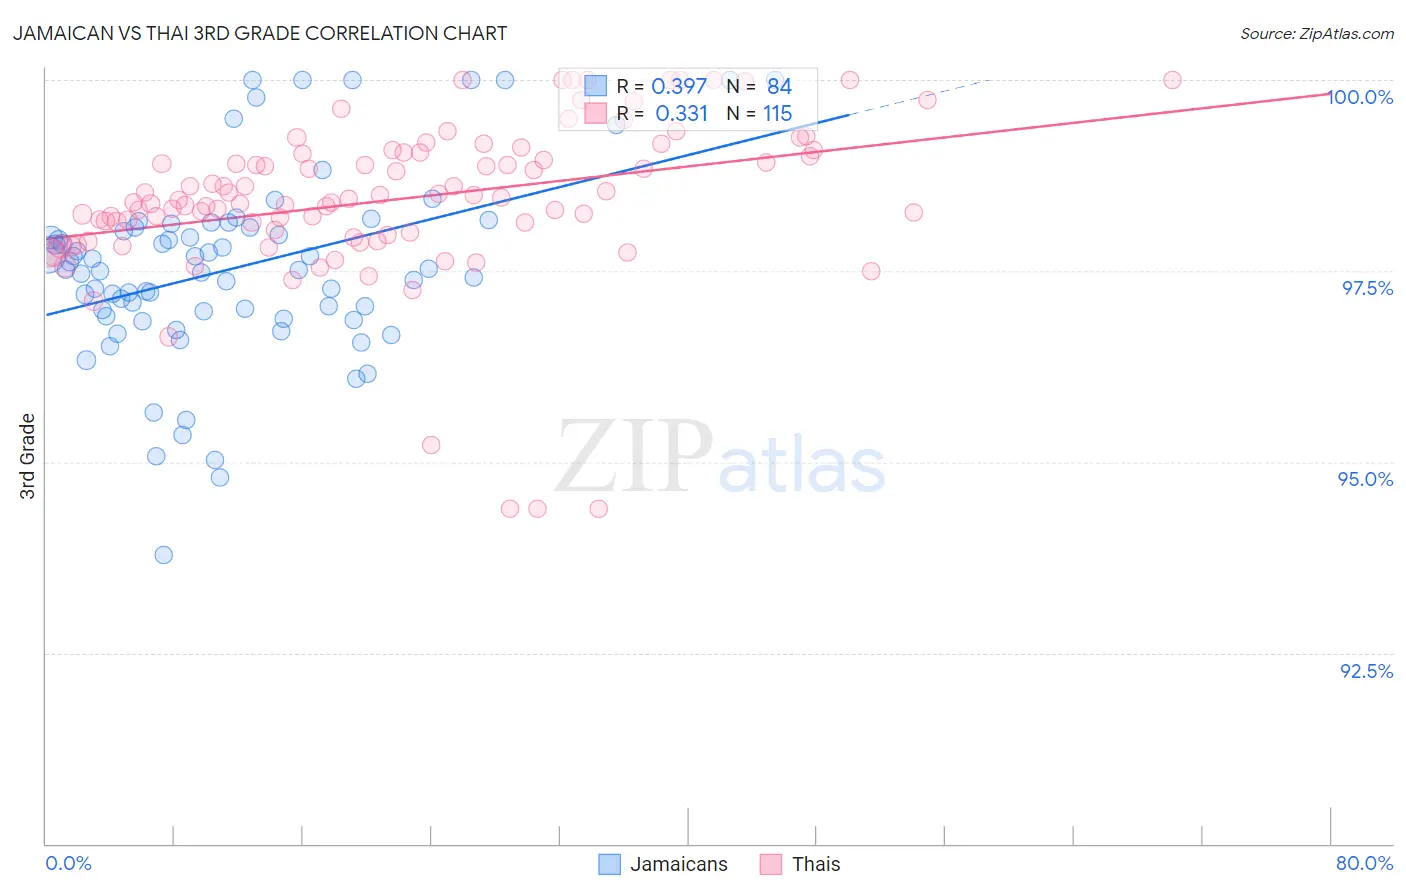
Jamaican vs Thai 3rd Grade Correlation Chart
The statistical analysis conducted on geographies consisting of 368,084,189 people shows a mild positive correlation between the proportion of Jamaicans and percentage of population with at least 3rd grade education in the United States with a correlation coefficient (R) of 0.397 and weighted average of 97.4%. Similarly, the statistical analysis conducted on geographies consisting of 475,866,115 people shows a mild positive correlation between the proportion of Thais and percentage of population with at least 3rd grade education in the United States with a correlation coefficient (R) of 0.331 and weighted average of 98.0%, a difference of 0.68%.
3rd Grade Correlation Summary
| Measurement | Jamaican | Thai |
| Minimum | 93.8% | 94.4% |
| Maximum | 100.0% | 100.0% |
| Range | 6.2% | 5.6% |
| Mean | 97.5% | 98.4% |
| Median | 97.5% | 98.4% |
| Interquartile 25% (IQ1) | 96.9% | 98.0% |
| Interquartile 75% (IQ3) | 98.1% | 99.1% |
| Interquartile Range (IQR) | 1.1% | 1.1% |
| Standard Deviation (Sample) | 1.2% | 1.0% |
| Standard Deviation (Population) | 1.2% | 1.0% |
Similar Demographics by 3rd Grade
Demographics Similar to Jamaicans by 3rd Grade
In terms of 3rd grade, the demographic groups most similar to Jamaicans are Immigrants from Middle Africa (97.4%, a difference of 0.010%), Immigrants from Asia (97.4%, a difference of 0.010%), Peruvian (97.4%, a difference of 0.010%), Immigrants from Africa (97.4%, a difference of 0.010%), and Assyrian/Chaldean/Syriac (97.4%, a difference of 0.020%).
| Demographics | Rating | Rank | 3rd Grade |
| Assyrians/Chaldeans/Syriacs | 1.0 /100 | #247 | Tragic 97.4% |
| Immigrants | Eastern Africa | 0.9 /100 | #248 | Tragic 97.4% |
| South Americans | 0.9 /100 | #249 | Tragic 97.4% |
| Immigrants | Middle Africa | 0.9 /100 | #250 | Tragic 97.4% |
| Immigrants | Asia | 0.8 /100 | #251 | Tragic 97.4% |
| Peruvians | 0.8 /100 | #252 | Tragic 97.4% |
| Immigrants | Africa | 0.8 /100 | #253 | Tragic 97.4% |
| Jamaicans | 0.7 /100 | #254 | Tragic 97.4% |
| Bolivians | 0.6 /100 | #255 | Tragic 97.3% |
| Immigrants | Congo | 0.6 /100 | #256 | Tragic 97.3% |
| Immigrants | Colombia | 0.5 /100 | #257 | Tragic 97.3% |
| Immigrants | Liberia | 0.5 /100 | #258 | Tragic 97.3% |
| Armenians | 0.4 /100 | #259 | Tragic 97.3% |
| Immigrants | Ethiopia | 0.4 /100 | #260 | Tragic 97.3% |
| Immigrants | South America | 0.4 /100 | #261 | Tragic 97.3% |
Demographics Similar to Thais by 3rd Grade
In terms of 3rd grade, the demographic groups most similar to Thais are Menominee (98.0%, a difference of 0.0%), Okinawan (98.0%, a difference of 0.0%), Immigrants from Latvia (98.0%, a difference of 0.010%), Immigrants from Norway (98.0%, a difference of 0.010%), and Immigrants from France (98.0%, a difference of 0.010%).
| Demographics | Rating | Rank | 3rd Grade |
| Bhutanese | 97.2 /100 | #106 | Exceptional 98.1% |
| Immigrants | Czechoslovakia | 97.0 /100 | #107 | Exceptional 98.0% |
| Immigrants | Singapore | 96.7 /100 | #108 | Exceptional 98.0% |
| Pima | 96.7 /100 | #109 | Exceptional 98.0% |
| Immigrants | Switzerland | 96.6 /100 | #110 | Exceptional 98.0% |
| Basques | 96.5 /100 | #111 | Exceptional 98.0% |
| Immigrants | Latvia | 96.0 /100 | #112 | Exceptional 98.0% |
| Thais | 95.5 /100 | #113 | Exceptional 98.0% |
| Menominee | 95.4 /100 | #114 | Exceptional 98.0% |
| Okinawans | 95.2 /100 | #115 | Exceptional 98.0% |
| Immigrants | Norway | 95.2 /100 | #116 | Exceptional 98.0% |
| Immigrants | France | 95.1 /100 | #117 | Exceptional 98.0% |
| Iranians | 94.9 /100 | #118 | Exceptional 98.0% |
| Spanish | 94.8 /100 | #119 | Exceptional 98.0% |
| Immigrants | Croatia | 94.4 /100 | #120 | Exceptional 98.0% |