Immigrants from Kazakhstan vs Spanish American 3rd Grade
COMPARE
Immigrants from Kazakhstan
Spanish American
3rd Grade
3rd Grade Comparison
Immigrants from Kazakhstan
Spanish Americans
97.7%
3RD GRADE
37.4/ 100
METRIC RATING
184th/ 347
METRIC RANK
97.8%
3RD GRADE
51.8/ 100
METRIC RATING
172nd/ 347
METRIC RANK
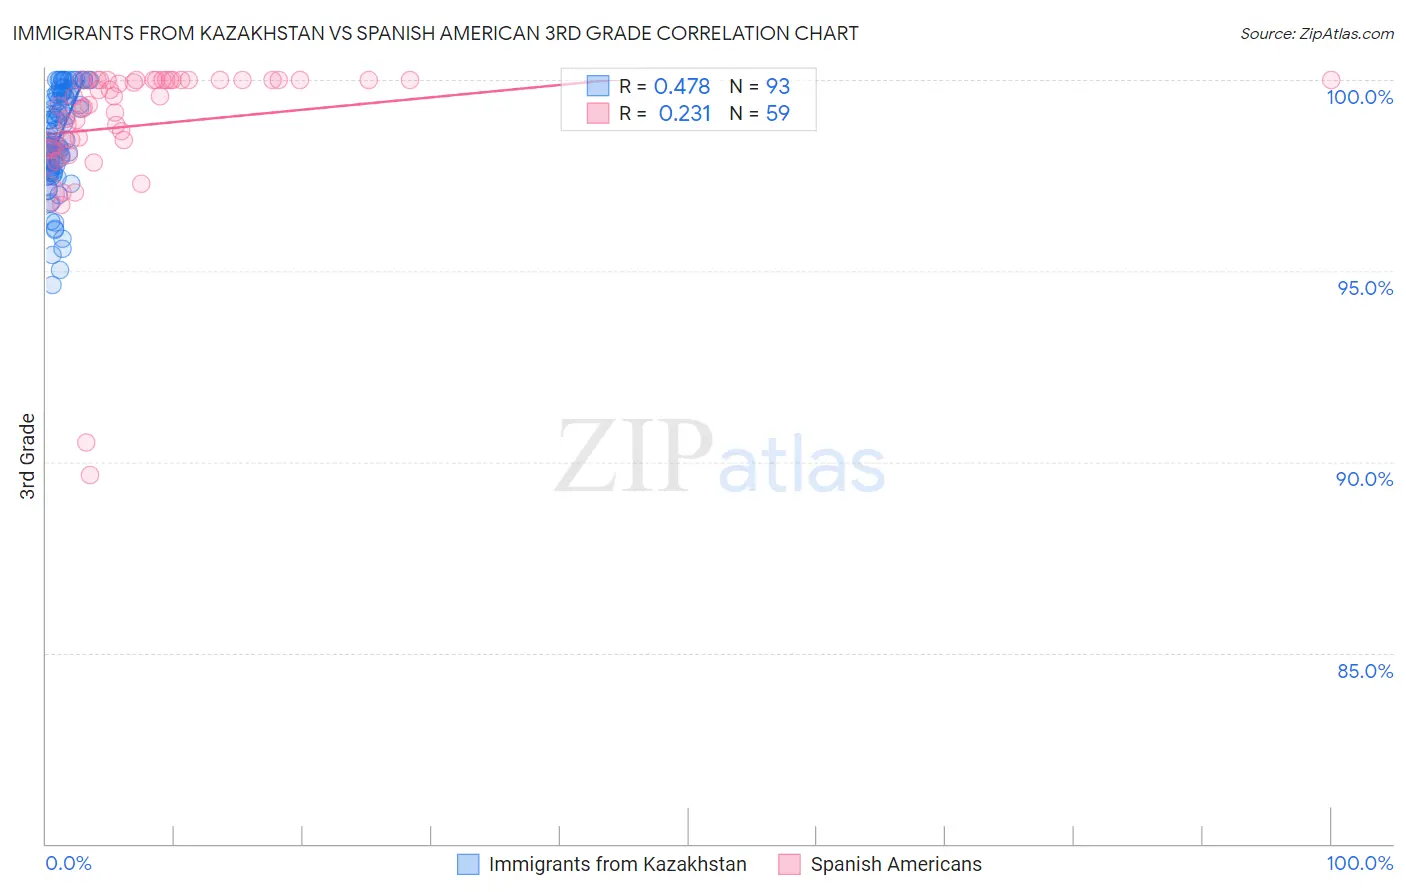
Immigrants from Kazakhstan vs Spanish American 3rd Grade Correlation Chart
The statistical analysis conducted on geographies consisting of 124,444,388 people shows a moderate positive correlation between the proportion of Immigrants from Kazakhstan and percentage of population with at least 3rd grade education in the United States with a correlation coefficient (R) of 0.478 and weighted average of 97.7%. Similarly, the statistical analysis conducted on geographies consisting of 103,168,542 people shows a weak positive correlation between the proportion of Spanish Americans and percentage of population with at least 3rd grade education in the United States with a correlation coefficient (R) of 0.231 and weighted average of 97.8%, a difference of 0.050%.
3rd Grade Correlation Summary
| Measurement | Immigrants from Kazakhstan | Spanish American |
| Minimum | 94.6% | 89.6% |
| Maximum | 100.0% | 100.0% |
| Range | 5.4% | 10.4% |
| Mean | 98.5% | 98.8% |
| Median | 98.4% | 99.3% |
| Interquartile 25% (IQ1) | 97.7% | 98.3% |
| Interquartile 75% (IQ3) | 99.6% | 100.0% |
| Interquartile Range (IQR) | 1.9% | 1.7% |
| Standard Deviation (Sample) | 1.3% | 1.9% |
| Standard Deviation (Population) | 1.3% | 1.9% |
Demographics Similar to Immigrants from Kazakhstan and Spanish Americans by 3rd Grade
In terms of 3rd grade, the demographic groups most similar to Immigrants from Kazakhstan are Immigrants from Argentina (97.7%, a difference of 0.0%), Portuguese (97.7%, a difference of 0.0%), Arab (97.7%, a difference of 0.010%), Native/Alaskan (97.7%, a difference of 0.010%), and Immigrants from Taiwan (97.7%, a difference of 0.010%). Similarly, the demographic groups most similar to Spanish Americans are Kenyan (97.8%, a difference of 0.0%), Immigrants from Korea (97.8%, a difference of 0.0%), Immigrants from Spain (97.8%, a difference of 0.010%), Comanche (97.8%, a difference of 0.010%), and Brazilian (97.8%, a difference of 0.010%).
| Demographics | Rating | Rank | 3rd Grade |
| Immigrants | Spain | 54.3 /100 | #168 | Average 97.8% |
| Comanche | 53.8 /100 | #169 | Average 97.8% |
| Brazilians | 53.7 /100 | #170 | Average 97.8% |
| Kenyans | 51.8 /100 | #171 | Average 97.8% |
| Spanish Americans | 51.8 /100 | #172 | Average 97.8% |
| Immigrants | Korea | 50.9 /100 | #173 | Average 97.8% |
| Navajo | 50.0 /100 | #174 | Average 97.8% |
| Immigrants | Micronesia | 47.6 /100 | #175 | Average 97.8% |
| Immigrants | Poland | 47.1 /100 | #176 | Average 97.8% |
| Egyptians | 46.6 /100 | #177 | Average 97.7% |
| Immigrants | Brazil | 46.4 /100 | #178 | Average 97.7% |
| Immigrants | Belarus | 45.9 /100 | #179 | Average 97.7% |
| Immigrants | Sri Lanka | 45.1 /100 | #180 | Average 97.7% |
| Immigrants | Venezuela | 44.4 /100 | #181 | Average 97.7% |
| Argentineans | 42.9 /100 | #182 | Average 97.7% |
| Arabs | 40.0 /100 | #183 | Fair 97.7% |
| Immigrants | Kazakhstan | 37.4 /100 | #184 | Fair 97.7% |
| Immigrants | Argentina | 37.0 /100 | #185 | Fair 97.7% |
| Portuguese | 36.2 /100 | #186 | Fair 97.7% |
| Natives/Alaskans | 35.2 /100 | #187 | Fair 97.7% |
| Immigrants | Taiwan | 34.2 /100 | #188 | Fair 97.7% |