Immigrants from Sierra Leone vs Spanish American 3rd Grade
COMPARE
Immigrants from Sierra Leone
Spanish American
3rd Grade
3rd Grade Comparison
Immigrants from Sierra Leone
Spanish Americans
97.3%
3RD GRADE
0.4/ 100
METRIC RATING
262nd/ 347
METRIC RANK
97.8%
3RD GRADE
51.8/ 100
METRIC RATING
172nd/ 347
METRIC RANK
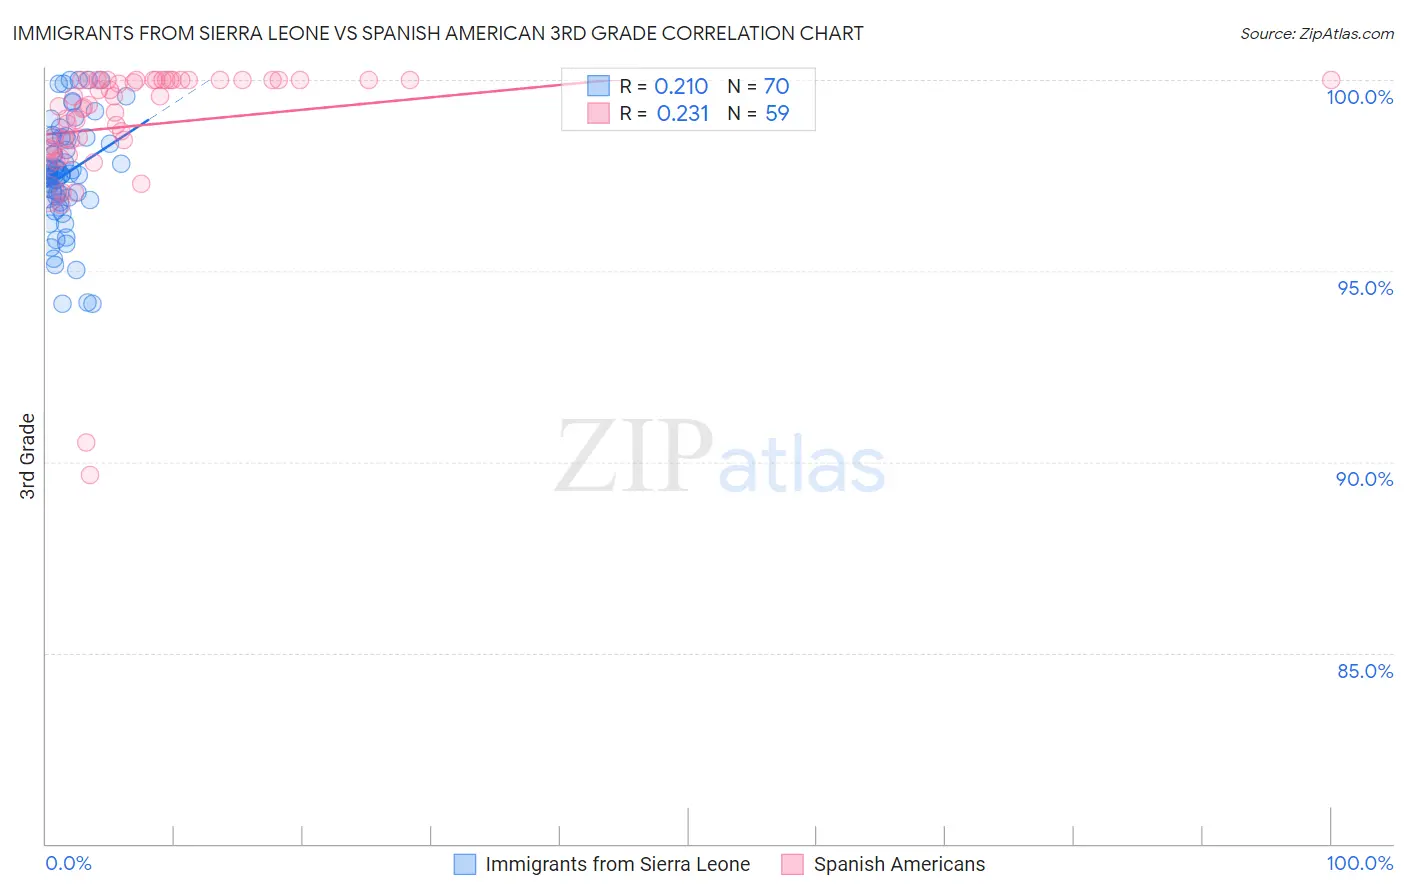
Immigrants from Sierra Leone vs Spanish American 3rd Grade Correlation Chart
The statistical analysis conducted on geographies consisting of 101,634,956 people shows a weak positive correlation between the proportion of Immigrants from Sierra Leone and percentage of population with at least 3rd grade education in the United States with a correlation coefficient (R) of 0.210 and weighted average of 97.3%. Similarly, the statistical analysis conducted on geographies consisting of 103,168,542 people shows a weak positive correlation between the proportion of Spanish Americans and percentage of population with at least 3rd grade education in the United States with a correlation coefficient (R) of 0.231 and weighted average of 97.8%, a difference of 0.49%.
3rd Grade Correlation Summary
| Measurement | Immigrants from Sierra Leone | Spanish American |
| Minimum | 94.1% | 89.6% |
| Maximum | 100.0% | 100.0% |
| Range | 5.9% | 10.4% |
| Mean | 97.5% | 98.8% |
| Median | 97.5% | 99.3% |
| Interquartile 25% (IQ1) | 96.9% | 98.3% |
| Interquartile 75% (IQ3) | 98.5% | 100.0% |
| Interquartile Range (IQR) | 1.6% | 1.7% |
| Standard Deviation (Sample) | 1.4% | 1.9% |
| Standard Deviation (Population) | 1.4% | 1.9% |
Similar Demographics by 3rd Grade
Demographics Similar to Immigrants from Sierra Leone by 3rd Grade
In terms of 3rd grade, the demographic groups most similar to Immigrants from Sierra Leone are Taiwanese (97.3%, a difference of 0.0%), Immigrants from Ethiopia (97.3%, a difference of 0.010%), Immigrants from South America (97.3%, a difference of 0.010%), West Indian (97.3%, a difference of 0.010%), and Immigrants from Liberia (97.3%, a difference of 0.020%).
| Demographics | Rating | Rank | 3rd Grade |
| Bolivians | 0.6 /100 | #255 | Tragic 97.3% |
| Immigrants | Congo | 0.6 /100 | #256 | Tragic 97.3% |
| Immigrants | Colombia | 0.5 /100 | #257 | Tragic 97.3% |
| Immigrants | Liberia | 0.5 /100 | #258 | Tragic 97.3% |
| Armenians | 0.4 /100 | #259 | Tragic 97.3% |
| Immigrants | Ethiopia | 0.4 /100 | #260 | Tragic 97.3% |
| Immigrants | South America | 0.4 /100 | #261 | Tragic 97.3% |
| Immigrants | Sierra Leone | 0.4 /100 | #262 | Tragic 97.3% |
| Taiwanese | 0.3 /100 | #263 | Tragic 97.3% |
| West Indians | 0.3 /100 | #264 | Tragic 97.3% |
| Immigrants | Jamaica | 0.3 /100 | #265 | Tragic 97.3% |
| Yaqui | 0.3 /100 | #266 | Tragic 97.3% |
| Immigrants | Nigeria | 0.3 /100 | #267 | Tragic 97.3% |
| Cubans | 0.2 /100 | #268 | Tragic 97.3% |
| Fijians | 0.2 /100 | #269 | Tragic 97.3% |
Demographics Similar to Spanish Americans by 3rd Grade
In terms of 3rd grade, the demographic groups most similar to Spanish Americans are Kenyan (97.8%, a difference of 0.0%), Immigrants from Korea (97.8%, a difference of 0.0%), Ugandan (97.8%, a difference of 0.010%), Dutch West Indian (97.8%, a difference of 0.010%), and Chilean (97.8%, a difference of 0.010%).
| Demographics | Rating | Rank | 3rd Grade |
| Ugandans | 56.1 /100 | #165 | Average 97.8% |
| Dutch West Indians | 55.5 /100 | #166 | Average 97.8% |
| Chileans | 55.3 /100 | #167 | Average 97.8% |
| Immigrants | Spain | 54.3 /100 | #168 | Average 97.8% |
| Comanche | 53.8 /100 | #169 | Average 97.8% |
| Brazilians | 53.7 /100 | #170 | Average 97.8% |
| Kenyans | 51.8 /100 | #171 | Average 97.8% |
| Spanish Americans | 51.8 /100 | #172 | Average 97.8% |
| Immigrants | Korea | 50.9 /100 | #173 | Average 97.8% |
| Navajo | 50.0 /100 | #174 | Average 97.8% |
| Immigrants | Micronesia | 47.6 /100 | #175 | Average 97.8% |
| Immigrants | Poland | 47.1 /100 | #176 | Average 97.8% |
| Egyptians | 46.6 /100 | #177 | Average 97.7% |
| Immigrants | Brazil | 46.4 /100 | #178 | Average 97.7% |
| Immigrants | Belarus | 45.9 /100 | #179 | Average 97.7% |