Lithuanian vs Spanish American 3rd Grade
COMPARE
Lithuanian
Spanish American
3rd Grade
3rd Grade Comparison
Lithuanians
Spanish Americans
98.5%
3RD GRADE
100.0/ 100
METRIC RATING
21st/ 347
METRIC RANK
97.8%
3RD GRADE
51.8/ 100
METRIC RATING
172nd/ 347
METRIC RANK
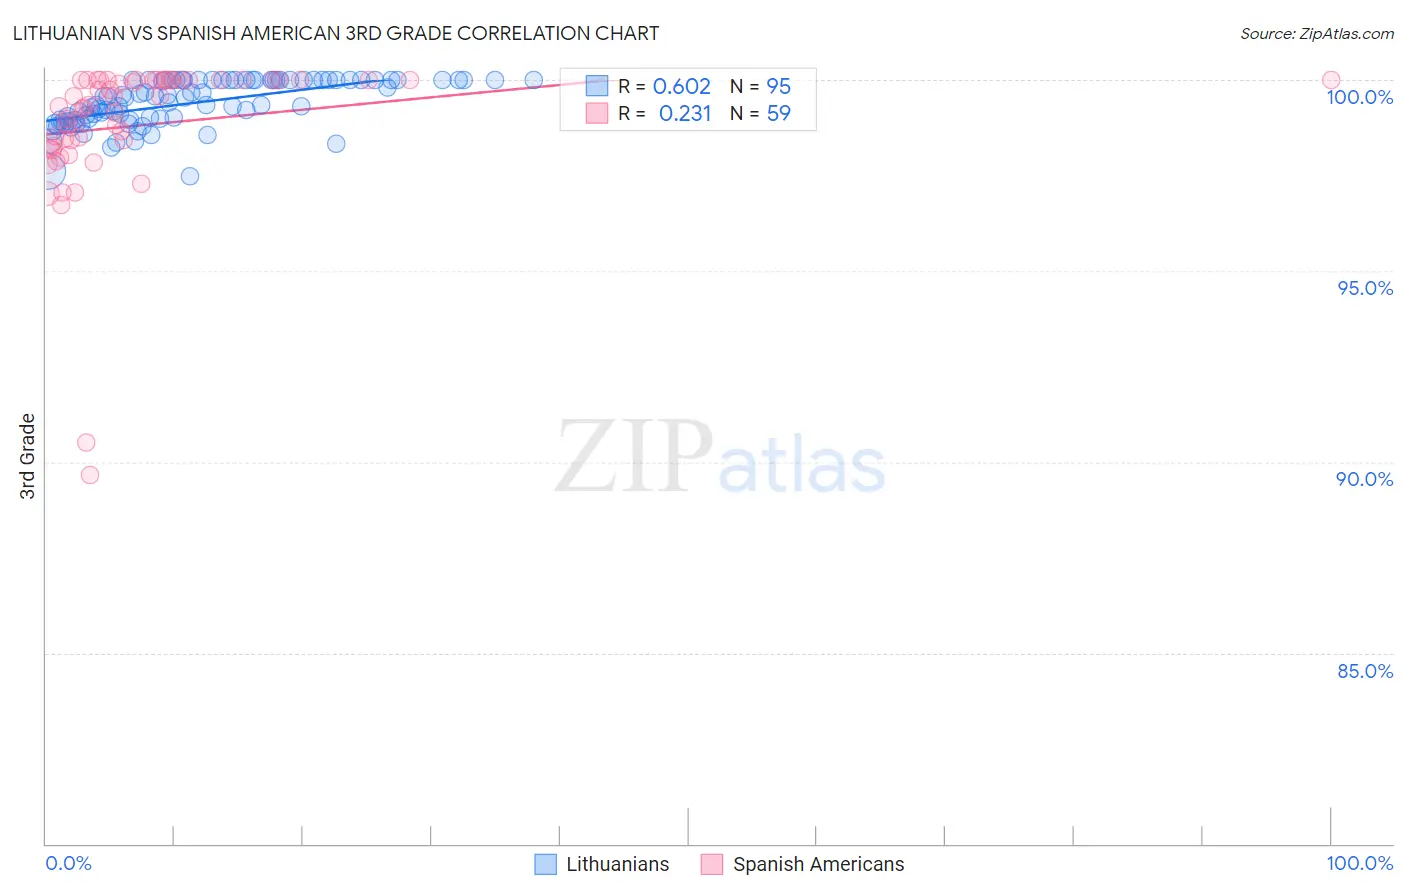
Lithuanian vs Spanish American 3rd Grade Correlation Chart
The statistical analysis conducted on geographies consisting of 421,946,231 people shows a significant positive correlation between the proportion of Lithuanians and percentage of population with at least 3rd grade education in the United States with a correlation coefficient (R) of 0.602 and weighted average of 98.5%. Similarly, the statistical analysis conducted on geographies consisting of 103,168,542 people shows a weak positive correlation between the proportion of Spanish Americans and percentage of population with at least 3rd grade education in the United States with a correlation coefficient (R) of 0.231 and weighted average of 97.8%, a difference of 0.74%.
3rd Grade Correlation Summary
| Measurement | Lithuanian | Spanish American |
| Minimum | 97.5% | 89.6% |
| Maximum | 100.0% | 100.0% |
| Range | 2.5% | 10.4% |
| Mean | 99.4% | 98.8% |
| Median | 99.5% | 99.3% |
| Interquartile 25% (IQ1) | 99.0% | 98.3% |
| Interquartile 75% (IQ3) | 100.0% | 100.0% |
| Interquartile Range (IQR) | 1.0% | 1.7% |
| Standard Deviation (Sample) | 0.60% | 1.9% |
| Standard Deviation (Population) | 0.60% | 1.9% |
Similar Demographics by 3rd Grade
Demographics Similar to Lithuanians by 3rd Grade
In terms of 3rd grade, the demographic groups most similar to Lithuanians are Pennsylvania German (98.5%, a difference of 0.0%), Finnish (98.5%, a difference of 0.0%), Sioux (98.5%, a difference of 0.0%), Irish (98.5%, a difference of 0.010%), and Polish (98.5%, a difference of 0.010%).
| Demographics | Rating | Rank | 3rd Grade |
| Carpatho Rusyns | 100.0 /100 | #14 | Exceptional 98.5% |
| Swedes | 100.0 /100 | #15 | Exceptional 98.5% |
| Scottish | 100.0 /100 | #16 | Exceptional 98.5% |
| Dutch | 100.0 /100 | #17 | Exceptional 98.5% |
| Irish | 100.0 /100 | #18 | Exceptional 98.5% |
| Poles | 100.0 /100 | #19 | Exceptional 98.5% |
| Pennsylvania Germans | 100.0 /100 | #20 | Exceptional 98.5% |
| Lithuanians | 100.0 /100 | #21 | Exceptional 98.5% |
| Finns | 100.0 /100 | #22 | Exceptional 98.5% |
| Sioux | 100.0 /100 | #23 | Exceptional 98.5% |
| Danes | 100.0 /100 | #24 | Exceptional 98.5% |
| Scotch-Irish | 100.0 /100 | #25 | Exceptional 98.5% |
| Aleuts | 100.0 /100 | #26 | Exceptional 98.5% |
| Croatians | 100.0 /100 | #27 | Exceptional 98.5% |
| French | 100.0 /100 | #28 | Exceptional 98.4% |
Demographics Similar to Spanish Americans by 3rd Grade
In terms of 3rd grade, the demographic groups most similar to Spanish Americans are Kenyan (97.8%, a difference of 0.0%), Immigrants from Korea (97.8%, a difference of 0.0%), Ugandan (97.8%, a difference of 0.010%), Dutch West Indian (97.8%, a difference of 0.010%), and Chilean (97.8%, a difference of 0.010%).
| Demographics | Rating | Rank | 3rd Grade |
| Ugandans | 56.1 /100 | #165 | Average 97.8% |
| Dutch West Indians | 55.5 /100 | #166 | Average 97.8% |
| Chileans | 55.3 /100 | #167 | Average 97.8% |
| Immigrants | Spain | 54.3 /100 | #168 | Average 97.8% |
| Comanche | 53.8 /100 | #169 | Average 97.8% |
| Brazilians | 53.7 /100 | #170 | Average 97.8% |
| Kenyans | 51.8 /100 | #171 | Average 97.8% |
| Spanish Americans | 51.8 /100 | #172 | Average 97.8% |
| Immigrants | Korea | 50.9 /100 | #173 | Average 97.8% |
| Navajo | 50.0 /100 | #174 | Average 97.8% |
| Immigrants | Micronesia | 47.6 /100 | #175 | Average 97.8% |
| Immigrants | Poland | 47.1 /100 | #176 | Average 97.8% |
| Egyptians | 46.6 /100 | #177 | Average 97.7% |
| Immigrants | Brazil | 46.4 /100 | #178 | Average 97.7% |
| Immigrants | Belarus | 45.9 /100 | #179 | Average 97.7% |