Lumbee vs Spanish American 3rd Grade
COMPARE
Lumbee
Spanish American
3rd Grade
3rd Grade Comparison
Lumbee
Spanish Americans
98.3%
3RD GRADE
99.8/ 100
METRIC RATING
48th/ 347
METRIC RANK
97.8%
3RD GRADE
51.8/ 100
METRIC RATING
172nd/ 347
METRIC RANK
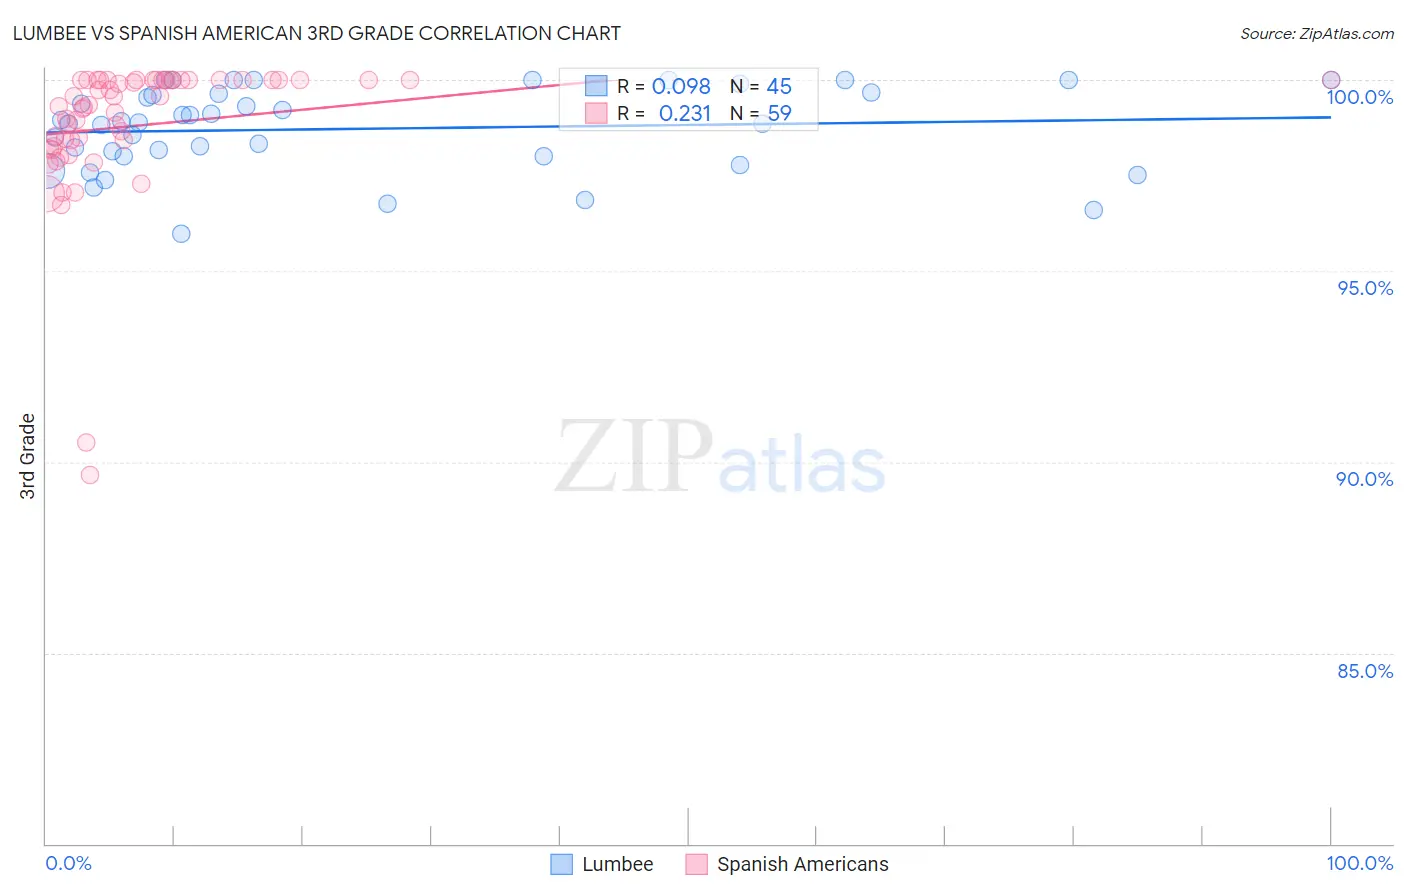
Lumbee vs Spanish American 3rd Grade Correlation Chart
The statistical analysis conducted on geographies consisting of 92,298,549 people shows a slight positive correlation between the proportion of Lumbee and percentage of population with at least 3rd grade education in the United States with a correlation coefficient (R) of 0.098 and weighted average of 98.3%. Similarly, the statistical analysis conducted on geographies consisting of 103,168,542 people shows a weak positive correlation between the proportion of Spanish Americans and percentage of population with at least 3rd grade education in the United States with a correlation coefficient (R) of 0.231 and weighted average of 97.8%, a difference of 0.53%.
3rd Grade Correlation Summary
| Measurement | Lumbee | Spanish American |
| Minimum | 96.0% | 89.6% |
| Maximum | 100.0% | 100.0% |
| Range | 4.0% | 10.4% |
| Mean | 98.7% | 98.8% |
| Median | 98.9% | 99.3% |
| Interquartile 25% (IQ1) | 98.0% | 98.3% |
| Interquartile 75% (IQ3) | 99.7% | 100.0% |
| Interquartile Range (IQR) | 1.7% | 1.7% |
| Standard Deviation (Sample) | 1.1% | 1.9% |
| Standard Deviation (Population) | 1.1% | 1.9% |
Similar Demographics by 3rd Grade
Demographics Similar to Lumbee by 3rd Grade
In terms of 3rd grade, the demographic groups most similar to Lumbee are Czechoslovakian (98.3%, a difference of 0.0%), Ottawa (98.3%, a difference of 0.010%), Estonian (98.3%, a difference of 0.010%), Celtic (98.3%, a difference of 0.010%), and Australian (98.3%, a difference of 0.020%).
| Demographics | Rating | Rank | 3rd Grade |
| Luxembourgers | 99.9 /100 | #41 | Exceptional 98.3% |
| Belgians | 99.9 /100 | #42 | Exceptional 98.3% |
| Northern Europeans | 99.9 /100 | #43 | Exceptional 98.3% |
| Hungarians | 99.9 /100 | #44 | Exceptional 98.3% |
| Native Hawaiians | 99.9 /100 | #45 | Exceptional 98.3% |
| Ottawa | 99.8 /100 | #46 | Exceptional 98.3% |
| Czechoslovakians | 99.8 /100 | #47 | Exceptional 98.3% |
| Lumbee | 99.8 /100 | #48 | Exceptional 98.3% |
| Estonians | 99.8 /100 | #49 | Exceptional 98.3% |
| Celtics | 99.8 /100 | #50 | Exceptional 98.3% |
| Australians | 99.8 /100 | #51 | Exceptional 98.3% |
| Whites/Caucasians | 99.8 /100 | #52 | Exceptional 98.3% |
| Immigrants | Scotland | 99.8 /100 | #53 | Exceptional 98.3% |
| Bulgarians | 99.8 /100 | #54 | Exceptional 98.3% |
| Americans | 99.8 /100 | #55 | Exceptional 98.3% |
Demographics Similar to Spanish Americans by 3rd Grade
In terms of 3rd grade, the demographic groups most similar to Spanish Americans are Kenyan (97.8%, a difference of 0.0%), Immigrants from Korea (97.8%, a difference of 0.0%), Ugandan (97.8%, a difference of 0.010%), Dutch West Indian (97.8%, a difference of 0.010%), and Chilean (97.8%, a difference of 0.010%).
| Demographics | Rating | Rank | 3rd Grade |
| Ugandans | 56.1 /100 | #165 | Average 97.8% |
| Dutch West Indians | 55.5 /100 | #166 | Average 97.8% |
| Chileans | 55.3 /100 | #167 | Average 97.8% |
| Immigrants | Spain | 54.3 /100 | #168 | Average 97.8% |
| Comanche | 53.8 /100 | #169 | Average 97.8% |
| Brazilians | 53.7 /100 | #170 | Average 97.8% |
| Kenyans | 51.8 /100 | #171 | Average 97.8% |
| Spanish Americans | 51.8 /100 | #172 | Average 97.8% |
| Immigrants | Korea | 50.9 /100 | #173 | Average 97.8% |
| Navajo | 50.0 /100 | #174 | Average 97.8% |
| Immigrants | Micronesia | 47.6 /100 | #175 | Average 97.8% |
| Immigrants | Poland | 47.1 /100 | #176 | Average 97.8% |
| Egyptians | 46.6 /100 | #177 | Average 97.7% |
| Immigrants | Brazil | 46.4 /100 | #178 | Average 97.7% |
| Immigrants | Belarus | 45.9 /100 | #179 | Average 97.7% |