Jamaican vs British West Indian 3rd Grade
COMPARE
Jamaican
British West Indian
3rd Grade
3rd Grade Comparison
Jamaicans
British West Indians
97.4%
3RD GRADE
0.7/ 100
METRIC RATING
254th/ 347
METRIC RANK
97.0%
3RD GRADE
0.0/ 100
METRIC RATING
292nd/ 347
METRIC RANK
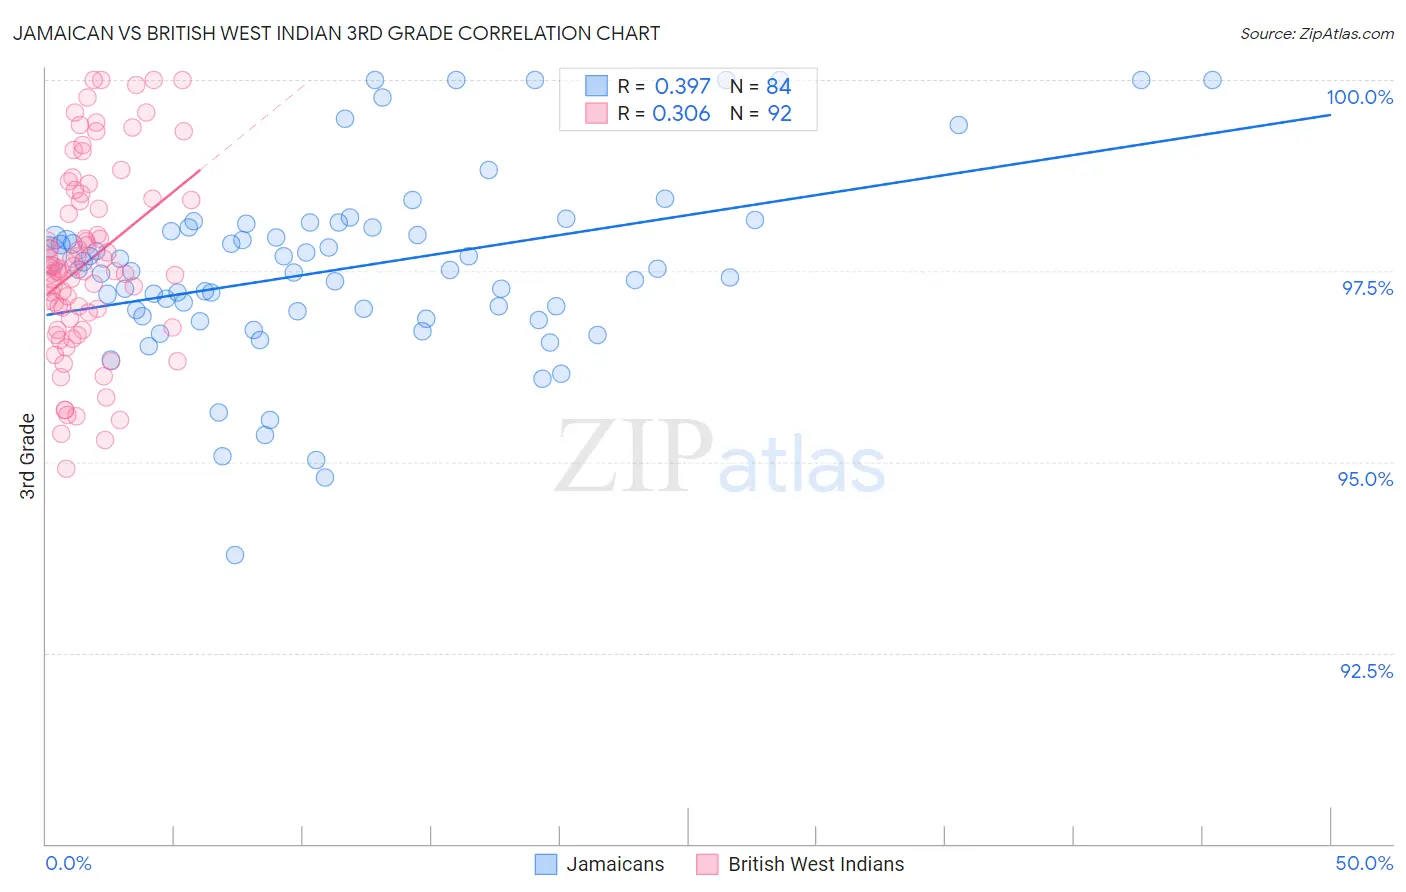
Jamaican vs British West Indian 3rd Grade Correlation Chart
The statistical analysis conducted on geographies consisting of 368,084,189 people shows a mild positive correlation between the proportion of Jamaicans and percentage of population with at least 3rd grade education in the United States with a correlation coefficient (R) of 0.397 and weighted average of 97.4%. Similarly, the statistical analysis conducted on geographies consisting of 152,691,173 people shows a mild positive correlation between the proportion of British West Indians and percentage of population with at least 3rd grade education in the United States with a correlation coefficient (R) of 0.306 and weighted average of 97.0%, a difference of 0.33%.
3rd Grade Correlation Summary
| Measurement | Jamaican | British West Indian |
| Minimum | 93.8% | 94.9% |
| Maximum | 100.0% | 100.0% |
| Range | 6.2% | 5.1% |
| Mean | 97.5% | 97.6% |
| Median | 97.5% | 97.5% |
| Interquartile 25% (IQ1) | 96.9% | 96.8% |
| Interquartile 75% (IQ3) | 98.1% | 98.4% |
| Interquartile Range (IQR) | 1.1% | 1.6% |
| Standard Deviation (Sample) | 1.2% | 1.2% |
| Standard Deviation (Population) | 1.2% | 1.2% |
Similar Demographics by 3rd Grade
Demographics Similar to Jamaicans by 3rd Grade
In terms of 3rd grade, the demographic groups most similar to Jamaicans are Immigrants from Middle Africa (97.4%, a difference of 0.010%), Immigrants from Asia (97.4%, a difference of 0.010%), Peruvian (97.4%, a difference of 0.010%), Immigrants from Africa (97.4%, a difference of 0.010%), and Assyrian/Chaldean/Syriac (97.4%, a difference of 0.020%).
| Demographics | Rating | Rank | 3rd Grade |
| Assyrians/Chaldeans/Syriacs | 1.0 /100 | #247 | Tragic 97.4% |
| Immigrants | Eastern Africa | 0.9 /100 | #248 | Tragic 97.4% |
| South Americans | 0.9 /100 | #249 | Tragic 97.4% |
| Immigrants | Middle Africa | 0.9 /100 | #250 | Tragic 97.4% |
| Immigrants | Asia | 0.8 /100 | #251 | Tragic 97.4% |
| Peruvians | 0.8 /100 | #252 | Tragic 97.4% |
| Immigrants | Africa | 0.8 /100 | #253 | Tragic 97.4% |
| Jamaicans | 0.7 /100 | #254 | Tragic 97.4% |
| Bolivians | 0.6 /100 | #255 | Tragic 97.3% |
| Immigrants | Congo | 0.6 /100 | #256 | Tragic 97.3% |
| Immigrants | Colombia | 0.5 /100 | #257 | Tragic 97.3% |
| Immigrants | Liberia | 0.5 /100 | #258 | Tragic 97.3% |
| Armenians | 0.4 /100 | #259 | Tragic 97.3% |
| Immigrants | Ethiopia | 0.4 /100 | #260 | Tragic 97.3% |
| Immigrants | South America | 0.4 /100 | #261 | Tragic 97.3% |
Demographics Similar to British West Indians by 3rd Grade
In terms of 3rd grade, the demographic groups most similar to British West Indians are Immigrants from Portugal (97.0%, a difference of 0.010%), Immigrants from Afghanistan (97.0%, a difference of 0.010%), Immigrants from Grenada (97.0%, a difference of 0.030%), Immigrants from Thailand (97.1%, a difference of 0.040%), and Malaysian (97.0%, a difference of 0.040%).
| Demographics | Rating | Rank | 3rd Grade |
| Immigrants | Hong Kong | 0.0 /100 | #285 | Tragic 97.1% |
| Immigrants | Barbados | 0.0 /100 | #286 | Tragic 97.1% |
| Immigrants | St. Vincent and the Grenadines | 0.0 /100 | #287 | Tragic 97.1% |
| Immigrants | West Indies | 0.0 /100 | #288 | Tragic 97.1% |
| Immigrants | Thailand | 0.0 /100 | #289 | Tragic 97.1% |
| Immigrants | Portugal | 0.0 /100 | #290 | Tragic 97.0% |
| Immigrants | Afghanistan | 0.0 /100 | #291 | Tragic 97.0% |
| British West Indians | 0.0 /100 | #292 | Tragic 97.0% |
| Immigrants | Grenada | 0.0 /100 | #293 | Tragic 97.0% |
| Malaysians | 0.0 /100 | #294 | Tragic 97.0% |
| Immigrants | Eritrea | 0.0 /100 | #295 | Tragic 97.0% |
| Immigrants | Immigrants | 0.0 /100 | #296 | Tragic 96.9% |
| Haitians | 0.0 /100 | #297 | Tragic 96.9% |
| Immigrants | Dominica | 0.0 /100 | #298 | Tragic 96.9% |
| Somalis | 0.0 /100 | #299 | Tragic 96.8% |