Jamaican vs Immigrants from Portugal 7th Grade
COMPARE
Jamaican
Immigrants from Portugal
7th Grade
7th Grade Comparison
Jamaicans
Immigrants from Portugal
95.5%
7TH GRADE
2.2/ 100
METRIC RATING
239th/ 347
METRIC RANK
94.2%
7TH GRADE
0.0/ 100
METRIC RATING
307th/ 347
METRIC RANK
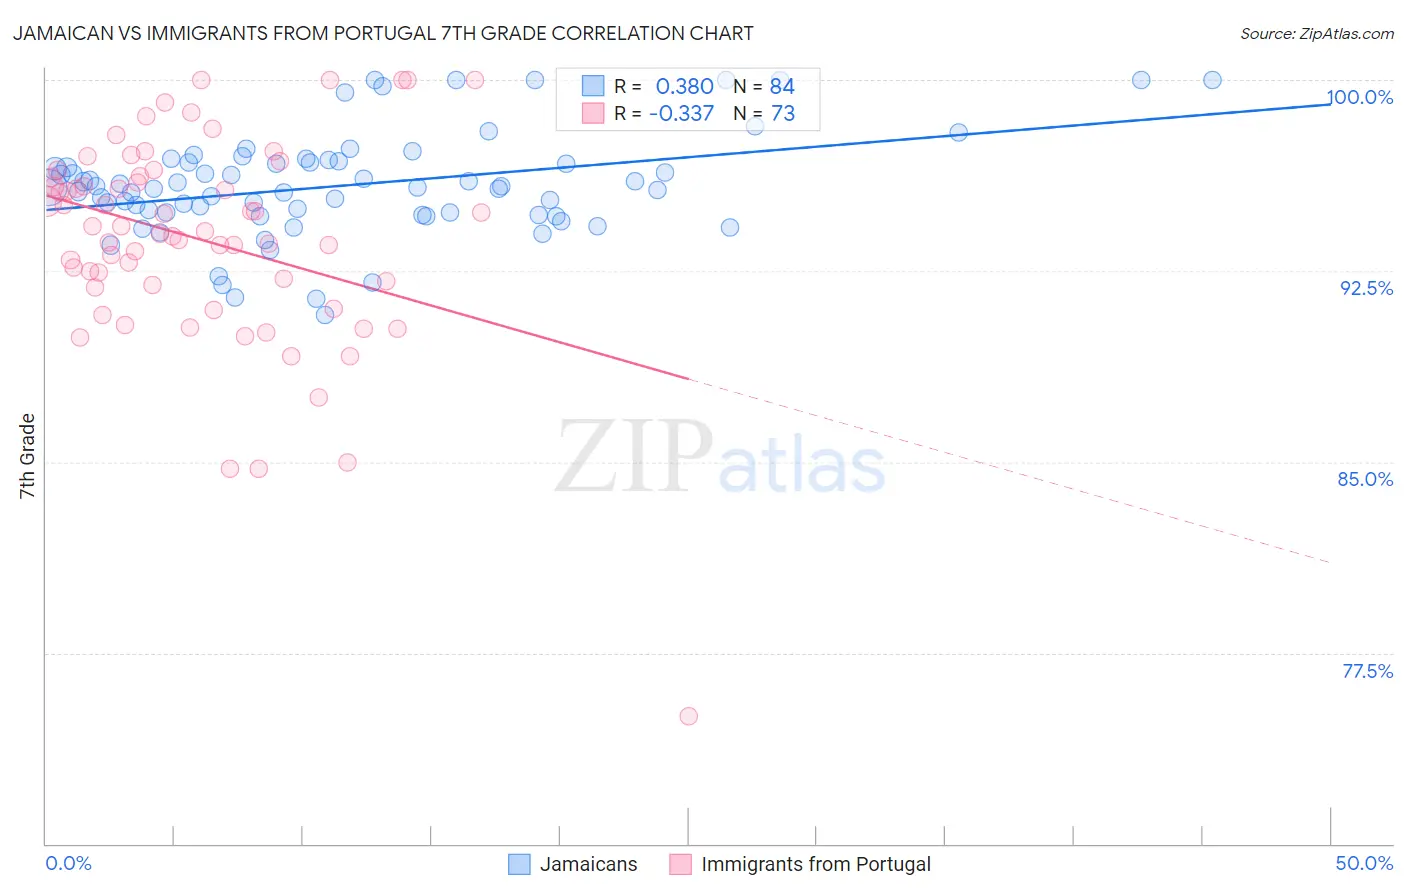
Jamaican vs Immigrants from Portugal 7th Grade Correlation Chart
The statistical analysis conducted on geographies consisting of 368,084,189 people shows a mild positive correlation between the proportion of Jamaicans and percentage of population with at least 7th grade education in the United States with a correlation coefficient (R) of 0.380 and weighted average of 95.5%. Similarly, the statistical analysis conducted on geographies consisting of 174,792,107 people shows a mild negative correlation between the proportion of Immigrants from Portugal and percentage of population with at least 7th grade education in the United States with a correlation coefficient (R) of -0.337 and weighted average of 94.2%, a difference of 1.4%.
7th Grade Correlation Summary
| Measurement | Jamaican | Immigrants from Portugal |
| Minimum | 90.8% | 75.0% |
| Maximum | 100.0% | 100.0% |
| Range | 9.2% | 25.0% |
| Mean | 95.9% | 93.7% |
| Median | 95.8% | 94.1% |
| Interquartile 25% (IQ1) | 94.7% | 91.9% |
| Interquartile 75% (IQ3) | 96.8% | 96.2% |
| Interquartile Range (IQR) | 2.0% | 4.3% |
| Standard Deviation (Sample) | 2.0% | 4.1% |
| Standard Deviation (Population) | 2.0% | 4.1% |
Similar Demographics by 7th Grade
Demographics Similar to Jamaicans by 7th Grade
In terms of 7th grade, the demographic groups most similar to Jamaicans are Immigrants from Asia (95.5%, a difference of 0.010%), Indian (Asian) (95.5%, a difference of 0.010%), Immigrants from Sierra Leone (95.5%, a difference of 0.020%), South American Indian (95.5%, a difference of 0.020%), and Immigrants from Senegal (95.5%, a difference of 0.020%).
| Demographics | Rating | Rank | 7th Grade |
| Costa Ricans | 3.3 /100 | #232 | Tragic 95.5% |
| Immigrants | Indonesia | 3.3 /100 | #233 | Tragic 95.5% |
| Nigerians | 3.0 /100 | #234 | Tragic 95.5% |
| Immigrants | Africa | 2.7 /100 | #235 | Tragic 95.5% |
| Asians | 2.6 /100 | #236 | Tragic 95.5% |
| Immigrants | Asia | 2.3 /100 | #237 | Tragic 95.5% |
| Indians (Asian) | 2.3 /100 | #238 | Tragic 95.5% |
| Jamaicans | 2.2 /100 | #239 | Tragic 95.5% |
| Immigrants | Sierra Leone | 2.0 /100 | #240 | Tragic 95.5% |
| South American Indians | 2.0 /100 | #241 | Tragic 95.5% |
| Immigrants | Senegal | 1.9 /100 | #242 | Tragic 95.5% |
| U.S. Virgin Islanders | 1.6 /100 | #243 | Tragic 95.4% |
| Uruguayans | 1.6 /100 | #244 | Tragic 95.4% |
| Immigrants | Middle Africa | 1.5 /100 | #245 | Tragic 95.4% |
| Ethiopians | 1.5 /100 | #246 | Tragic 95.4% |
Demographics Similar to Immigrants from Portugal by 7th Grade
In terms of 7th grade, the demographic groups most similar to Immigrants from Portugal are Immigrants from Guyana (94.2%, a difference of 0.020%), Cape Verdean (94.1%, a difference of 0.080%), Ecuadorian (94.0%, a difference of 0.14%), Guyanese (94.3%, a difference of 0.15%), and Immigrants from Caribbean (94.0%, a difference of 0.15%).
| Demographics | Rating | Rank | 7th Grade |
| Immigrants | Burma/Myanmar | 0.0 /100 | #300 | Tragic 94.5% |
| Immigrants | Dominica | 0.0 /100 | #301 | Tragic 94.5% |
| Immigrants | Laos | 0.0 /100 | #302 | Tragic 94.5% |
| Sri Lankans | 0.0 /100 | #303 | Tragic 94.4% |
| Immigrants | Haiti | 0.0 /100 | #304 | Tragic 94.3% |
| Guyanese | 0.0 /100 | #305 | Tragic 94.3% |
| Immigrants | Guyana | 0.0 /100 | #306 | Tragic 94.2% |
| Immigrants | Portugal | 0.0 /100 | #307 | Tragic 94.2% |
| Cape Verdeans | 0.0 /100 | #308 | Tragic 94.1% |
| Ecuadorians | 0.0 /100 | #309 | Tragic 94.0% |
| Immigrants | Caribbean | 0.0 /100 | #310 | Tragic 94.0% |
| Puerto Ricans | 0.0 /100 | #311 | Tragic 94.0% |
| Immigrants | Immigrants | 0.0 /100 | #312 | Tragic 94.0% |
| Immigrants | Bangladesh | 0.0 /100 | #313 | Tragic 94.0% |
| Japanese | 0.0 /100 | #314 | Tragic 94.0% |