Jamaican vs Immigrants from Barbados 7th Grade
COMPARE
Jamaican
Immigrants from Barbados
7th Grade
7th Grade Comparison
Jamaicans
Immigrants from Barbados
95.5%
7TH GRADE
2.2/ 100
METRIC RATING
239th/ 347
METRIC RANK
95.0%
7TH GRADE
0.1/ 100
METRIC RATING
283rd/ 347
METRIC RANK
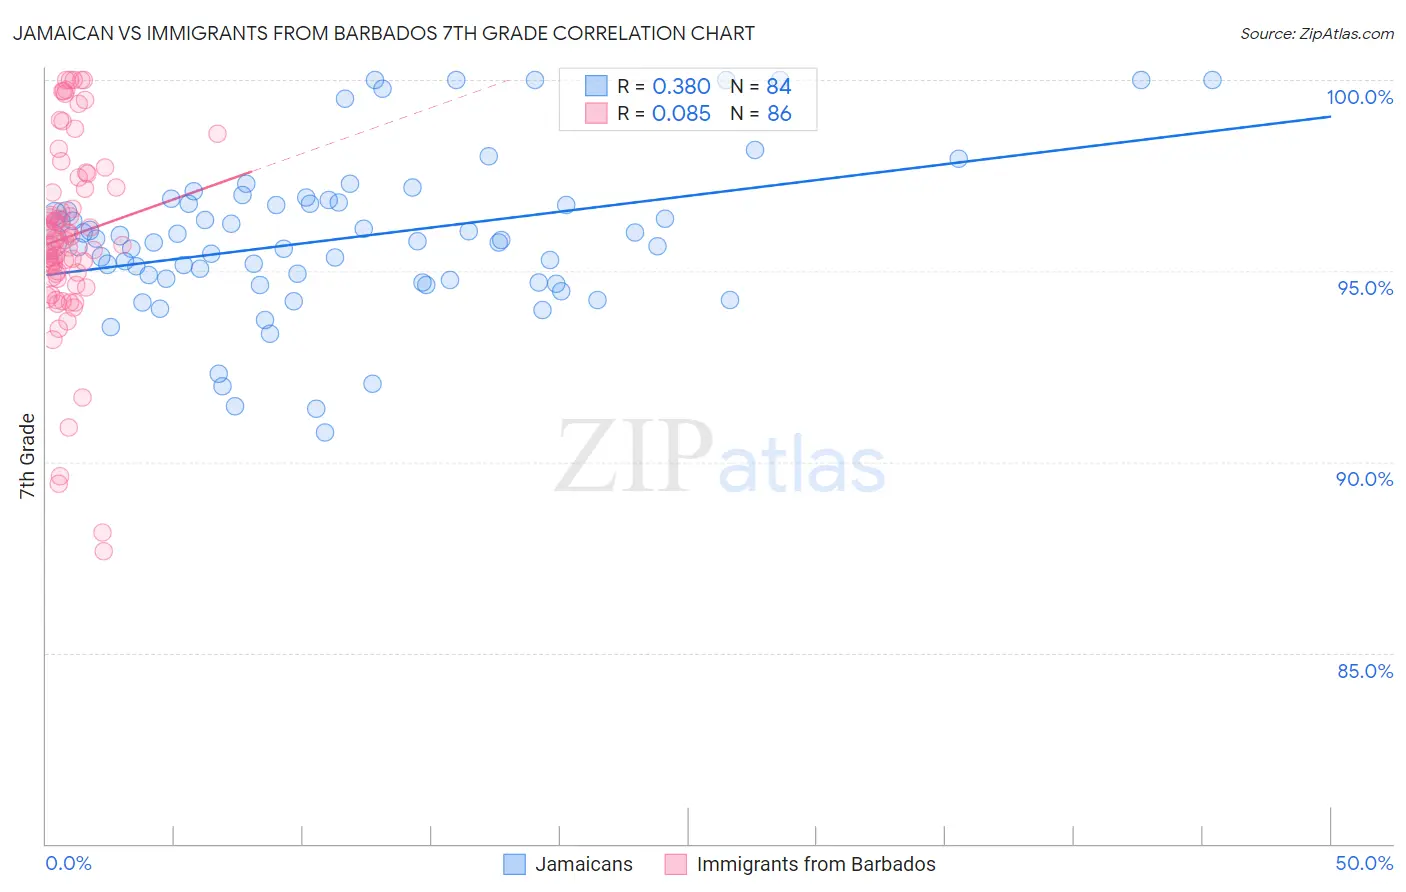
Jamaican vs Immigrants from Barbados 7th Grade Correlation Chart
The statistical analysis conducted on geographies consisting of 368,084,189 people shows a mild positive correlation between the proportion of Jamaicans and percentage of population with at least 7th grade education in the United States with a correlation coefficient (R) of 0.380 and weighted average of 95.5%. Similarly, the statistical analysis conducted on geographies consisting of 112,787,165 people shows a slight positive correlation between the proportion of Immigrants from Barbados and percentage of population with at least 7th grade education in the United States with a correlation coefficient (R) of 0.085 and weighted average of 95.0%, a difference of 0.55%.
7th Grade Correlation Summary
| Measurement | Jamaican | Immigrants from Barbados |
| Minimum | 90.8% | 87.6% |
| Maximum | 100.0% | 100.0% |
| Range | 9.2% | 12.4% |
| Mean | 95.9% | 95.9% |
| Median | 95.8% | 95.8% |
| Interquartile 25% (IQ1) | 94.7% | 94.9% |
| Interquartile 75% (IQ3) | 96.8% | 97.2% |
| Interquartile Range (IQR) | 2.0% | 2.3% |
| Standard Deviation (Sample) | 2.0% | 2.5% |
| Standard Deviation (Population) | 2.0% | 2.5% |
Similar Demographics by 7th Grade
Demographics Similar to Jamaicans by 7th Grade
In terms of 7th grade, the demographic groups most similar to Jamaicans are Immigrants from Asia (95.5%, a difference of 0.010%), Indian (Asian) (95.5%, a difference of 0.010%), Immigrants from Sierra Leone (95.5%, a difference of 0.020%), South American Indian (95.5%, a difference of 0.020%), and Immigrants from Senegal (95.5%, a difference of 0.020%).
| Demographics | Rating | Rank | 7th Grade |
| Costa Ricans | 3.3 /100 | #232 | Tragic 95.5% |
| Immigrants | Indonesia | 3.3 /100 | #233 | Tragic 95.5% |
| Nigerians | 3.0 /100 | #234 | Tragic 95.5% |
| Immigrants | Africa | 2.7 /100 | #235 | Tragic 95.5% |
| Asians | 2.6 /100 | #236 | Tragic 95.5% |
| Immigrants | Asia | 2.3 /100 | #237 | Tragic 95.5% |
| Indians (Asian) | 2.3 /100 | #238 | Tragic 95.5% |
| Jamaicans | 2.2 /100 | #239 | Tragic 95.5% |
| Immigrants | Sierra Leone | 2.0 /100 | #240 | Tragic 95.5% |
| South American Indians | 2.0 /100 | #241 | Tragic 95.5% |
| Immigrants | Senegal | 1.9 /100 | #242 | Tragic 95.5% |
| U.S. Virgin Islanders | 1.6 /100 | #243 | Tragic 95.4% |
| Uruguayans | 1.6 /100 | #244 | Tragic 95.4% |
| Immigrants | Middle Africa | 1.5 /100 | #245 | Tragic 95.4% |
| Ethiopians | 1.5 /100 | #246 | Tragic 95.4% |
Demographics Similar to Immigrants from Barbados by 7th Grade
In terms of 7th grade, the demographic groups most similar to Immigrants from Barbados are Armenian (95.0%, a difference of 0.0%), Immigrants from Eritrea (94.9%, a difference of 0.010%), Immigrants from Bolivia (95.0%, a difference of 0.060%), Immigrants from St. Vincent and the Grenadines (95.0%, a difference of 0.070%), and Tohono O'odham (95.0%, a difference of 0.070%).
| Demographics | Rating | Rank | 7th Grade |
| Immigrants | Thailand | 0.2 /100 | #276 | Tragic 95.1% |
| Immigrants | Afghanistan | 0.2 /100 | #277 | Tragic 95.1% |
| Immigrants | Trinidad and Tobago | 0.1 /100 | #278 | Tragic 95.1% |
| Barbadians | 0.1 /100 | #279 | Tragic 95.1% |
| Immigrants | St. Vincent and the Grenadines | 0.1 /100 | #280 | Tragic 95.0% |
| Tohono O'odham | 0.1 /100 | #281 | Tragic 95.0% |
| Immigrants | Bolivia | 0.1 /100 | #282 | Tragic 95.0% |
| Immigrants | Barbados | 0.1 /100 | #283 | Tragic 95.0% |
| Armenians | 0.1 /100 | #284 | Tragic 95.0% |
| Immigrants | Eritrea | 0.1 /100 | #285 | Tragic 94.9% |
| Immigrants | Philippines | 0.0 /100 | #286 | Tragic 94.9% |
| Immigrants | Peru | 0.0 /100 | #287 | Tragic 94.9% |
| British West Indians | 0.0 /100 | #288 | Tragic 94.8% |
| Taiwanese | 0.0 /100 | #289 | Tragic 94.8% |
| Malaysians | 0.0 /100 | #290 | Tragic 94.8% |