Immigrants from Greece vs Immigrants from Portugal 7th Grade

COMPARE

Immigrants from Greece
Race
Ancestry
AfghanAfricanAlaska NativeAlaskan AthabascanAlbanianAleutAlsatianAmericanApacheArabArapahoArgentineanArmenianAssyrian/Chaldean/SyriacAustralianAustrianBahamianBangladeshiBarbadianBasqueBelgianBelizeanBermudanBhutaneseBlackfeetBolivianBrazilianBritishBritish West IndianBulgarianBurmeseCajunCambodianCanadianCape VerdeanCarpatho RusynCelticCentral AmericanCentral American IndianCherokeeCheyenneChickasawChileanChineseChippewaChoctawColombianColvilleComancheCosta RicanCreeCreekCroatianCrowCubanCypriotCzechCzechoslovakianDanishDelawareDominicanDutchDutch West IndianEastern EuropeanEcuadorianEgyptianEnglishEstonianEthiopianEuropeanFijianFilipinoFinnishFrenchFrench American IndianFrench CanadianGermanGerman RussianGhanaianGreekGuamanian/ChamorroGuatemalanGuyaneseHaitianHmongHonduranHopiHoumaHungarianIcelanderIndian (Asian)IndonesianInupiatIranianIraqiIrishIroquoisIsraeliItalianJamaicanJapaneseJordanianKenyanKiowaKoreanLaotianLatvianLebaneseLiberianLithuanianLumbeeLuxembourgerMacedonianMalaysianMalteseMarshalleseMenomineeMexicanMexican American IndianMongolianMoroccanNative HawaiianNavajoNepaleseNew ZealanderNicaraguanNigerianNorthern EuropeanNorwegianOkinawanOsageOttawaPaiutePakistaniPalestinianPanamanianParaguayanPennsylvania GermanPeruvianPimaPolishPortuguesePotawatomiPuebloPuerto RicanPuget Sound SalishRomanianRussianSalvadoranSamoanScandinavianScotch-IrishScottishSeminoleSenegaleseSerbianShoshoneSierra LeoneanSiouxSlavicSlovakSloveneSomaliSouth AfricanSouth AmericanSouth American IndianSoviet UnionSpaniardSpanishSpanish AmericanSpanish American IndianSri LankanSubsaharan AfricanSudaneseSwedishSwissSyrianTaiwaneseThaiTlingit-HaidaTohono O'OdhamTonganTrinidadian and TobagonianTsimshianTurkishU.S. Virgin IslanderUgandanUkrainianUruguayanUteVenezuelanVietnameseWelshWest IndianYakamaYaquiYugoslavianYumanYup'ikZimbabwean
Immigration
NonimmigrantsImmigrantsAfghanistanAfricaAlbaniaArgentinaArmeniaAsiaAustraliaAustriaBahamasBangladeshBarbadosBelarusBelgiumBelizeBoliviaBosnia and HerzegovinaBrazilBulgariaBurma/MyanmarCabo VerdeCambodiaCameroonCanadaCaribbeanCentral AmericaChileChinaColombiaCongoCosta RicaCroatiaCubaCzechoslovakiaDenmarkDominicaDominican RepublicEastern AfricaEastern AsiaEastern EuropeEcuadorEgyptEl SalvadorEnglandEritreaEthiopiaEuropeFijiFranceGermanyGhanaGreeceGrenadaGuatemalaGuyanaHaitiHondurasHong KongHungaryIndiaIndonesiaIranIraqIrelandIsraelItalyJamaicaJapanJordanKazakhstanKenyaKoreaKuwaitLaosLatin AmericaLatviaLebanonLiberiaLithuaniaMalaysiaMexicoMicronesiaMiddle AfricaMoldovaMoroccoNepalNetherlandsNicaraguaNigeriaNorth AmericaNorth MacedoniaNorthern AfricaNorthern EuropeNorwayOceaniaPakistanPanamaPeruPhilippinesPolandRomaniaRussiaSaudi ArabiaScotlandSenegalSerbiaSierra LeoneSingaporeSomaliaSouth AfricaSouth AmericaSouth Central AsiaSouth Eastern AsiaSouthern EuropeSpainSri LankaSt. Vincent and the GrenadinesSudanSwedenSwitzerlandSyriaTaiwanThailandTrinidad and TobagoTurkeyUgandaUkraineUruguayUzbekistanVenezuelaVietnamWest IndiesWestern AfricaWestern AsiaWestern EuropeYemenZaireZimbabweAzores
Immigrants from Portugal
Race
Ancestry
AfghanAfricanAlaska NativeAlaskan AthabascanAlbanianAleutAlsatianAmericanApacheArabArapahoArgentineanArmenianAssyrian/Chaldean/SyriacAustralianAustrianBahamianBangladeshiBarbadianBasqueBelgianBelizeanBermudanBhutaneseBlackfeetBolivianBrazilianBritishBritish West IndianBulgarianBurmeseCajunCambodianCanadianCape VerdeanCarpatho RusynCelticCentral AmericanCentral American IndianCherokeeCheyenneChickasawChileanChineseChippewaChoctawColombianColvilleComancheCosta RicanCreeCreekCroatianCrowCubanCypriotCzechCzechoslovakianDanishDelawareDominicanDutchDutch West IndianEastern EuropeanEcuadorianEgyptianEnglishEstonianEthiopianEuropeanFijianFilipinoFinnishFrenchFrench American IndianFrench CanadianGermanGerman RussianGhanaianGreekGuamanian/ChamorroGuatemalanGuyaneseHaitianHmongHonduranHopiHoumaHungarianIcelanderIndian (Asian)IndonesianInupiatIranianIraqiIrishIroquoisIsraeliItalianJamaicanJapaneseJordanianKenyanKiowaKoreanLaotianLatvianLebaneseLiberianLithuanianLumbeeLuxembourgerMacedonianMalaysianMalteseMarshalleseMenomineeMexicanMexican American IndianMongolianMoroccanNative HawaiianNavajoNepaleseNew ZealanderNicaraguanNigerianNorthern EuropeanNorwegianOkinawanOsageOttawaPaiutePakistaniPalestinianPanamanianParaguayanPennsylvania GermanPeruvianPimaPolishPortuguesePotawatomiPuebloPuerto RicanPuget Sound SalishRomanianRussianSalvadoranSamoanScandinavianScotch-IrishScottishSeminoleSenegaleseSerbianShoshoneSierra LeoneanSiouxSlavicSlovakSloveneSomaliSouth AfricanSouth AmericanSouth American IndianSoviet UnionSpaniardSpanishSpanish AmericanSpanish American IndianSri LankanSubsaharan AfricanSudaneseSwedishSwissSyrianTaiwaneseThaiTlingit-HaidaTohono O'OdhamTonganTrinidadian and TobagonianTsimshianTurkishU.S. Virgin IslanderUgandanUkrainianUruguayanUteVenezuelanVietnameseWelshWest IndianYakamaYaquiYugoslavianYumanYup'ikZimbabwean
Immigration
NonimmigrantsImmigrantsAfghanistanAfricaAlbaniaArgentinaArmeniaAsiaAustraliaAustriaBahamasBangladeshBarbadosBelarusBelgiumBelizeBoliviaBosnia and HerzegovinaBrazilBulgariaBurma/MyanmarCabo VerdeCambodiaCameroonCanadaCaribbeanCentral AmericaChileChinaColombiaCongoCosta RicaCroatiaCubaCzechoslovakiaDenmarkDominicaDominican RepublicEastern AfricaEastern AsiaEastern EuropeEcuadorEgyptEl SalvadorEnglandEritreaEthiopiaEuropeFijiFranceGermanyGhanaGrenadaGuatemalaGuyanaHaitiHondurasHong KongHungaryIndiaIndonesiaIranIraqIrelandIsraelItalyJamaicaJapanJordanKazakhstanKenyaKoreaKuwaitLaosLatin AmericaLatviaLebanonLiberiaLithuaniaMalaysiaMexicoMicronesiaMiddle AfricaMoldovaMoroccoNepalNetherlandsNicaraguaNigeriaNorth AmericaNorth MacedoniaNorthern AfricaNorthern EuropeNorwayOceaniaPakistanPanamaPeruPhilippinesPolandPortugalRomaniaRussiaSaudi ArabiaScotlandSenegalSerbiaSierra LeoneSingaporeSomaliaSouth AfricaSouth AmericaSouth Central AsiaSouth Eastern AsiaSouthern EuropeSpainSri LankaSt. Vincent and the GrenadinesSudanSwedenSwitzerlandSyriaTaiwanThailandTrinidad and TobagoTurkeyUgandaUkraineUruguayUzbekistanVenezuelaVietnamWest IndiesWestern AfricaWestern AsiaWestern EuropeYemenZaireZimbabweAzores
7th Grade
Income
Poverty
Unemployment
Labor Participation
Family Structure
Vehicle Availability
Education Level
Disability

7th Grade Comparison

Immigrants from Greece

Immigrants from Portugal

Excellent
Tragic
96.3%
7TH GRADE
85.9/ 100
METRIC RATING
144th/ 347
METRIC RANK
94.2%
7TH GRADE
0.0/ 100
METRIC RATING
307th/ 347
METRIC RANK

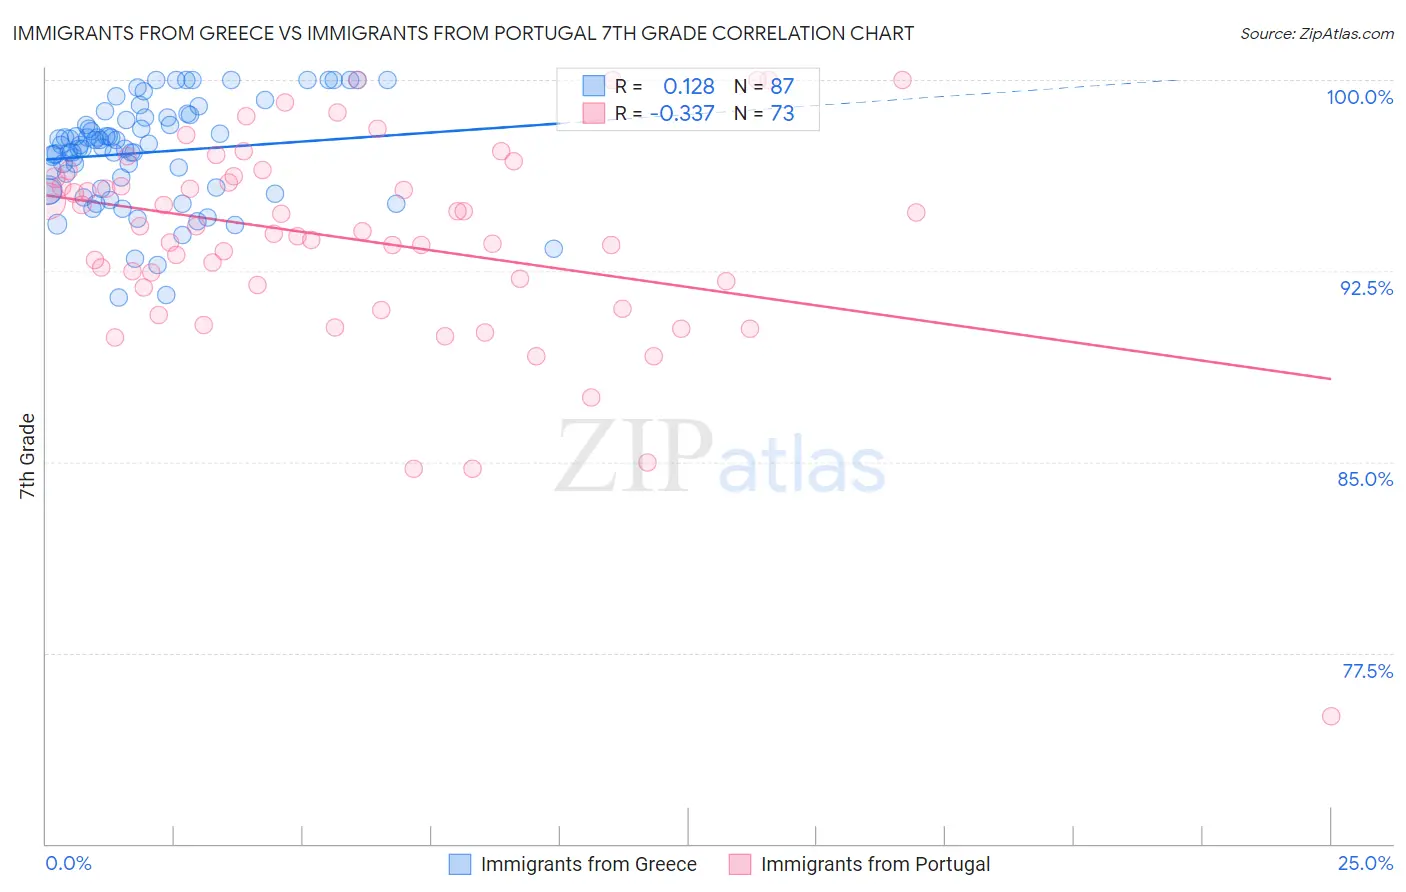
Immigrants from Greece vs Immigrants from Portugal 7th Grade Correlation Chart

The statistical analysis conducted on geographies consisting of 216,879,847 people shows a poor positive correlation between the proportion of Immigrants from Greece and percentage of population with at least 7th grade education in the United States with a correlation coefficient (R) of 0.128 and weighted average of 96.3%. Similarly, the statistical analysis conducted on geographies consisting of 174,792,107 people shows a mild negative correlation between the proportion of Immigrants from Portugal and percentage of population with at least 7th grade education in the United States with a correlation coefficient (R) of -0.337 and weighted average of 94.2%, a difference of 2.2%.
Immigrants from Greece vs Immigrants from Portugal 7th Grade

7th Grade Correlation Summary

MeasurementImmigrants from GreeceImmigrants from Portugal
Minimum91.4%75.0%
Maximum100.0%100.0%
Range8.6%25.0%
Mean97.2%93.7%
Median97.4%94.1%
Interquartile 25% (IQ1)95.7%91.9%
Interquartile 75% (IQ3)98.5%96.2%
Interquartile Range (IQR)2.8%4.3%
Standard Deviation (Sample)2.0%4.1%
Standard Deviation (Population)2.0%4.1%

Similar Demographics by 7th Grade

Demographics Similar to Immigrants from Greece by 7th Grade

In terms of 7th grade, the demographic groups most similar to Immigrants from Greece are Spanish (96.3%, a difference of 0.010%), Immigrants from South Central Asia (96.3%, a difference of 0.020%), Burmese (96.3%, a difference of 0.020%), Blackfeet (96.3%, a difference of 0.020%), and Cambodian (96.3%, a difference of 0.030%).
DemographicsRating | Rank7th Grade
Immigrants | Turkey
90.2
/100
|
#137
Exceptional
96.4%
Jordanians
90.0
/100
|
#138
Excellent
96.4%
Basques
89.3
/100
|
#139
Excellent
96.4%
Cambodians
88.3
/100
|
#140
Excellent
96.3%
Immigrants | South Central Asia
87.1
/100
|
#141
Excellent
96.3%
Burmese
87.1
/100
|
#142
Excellent
96.3%
Spanish
86.6
/100
|
#143
Excellent
96.3%
Immigrants | Greece
85.9
/100
|
#144
Excellent
96.3%
Blackfeet
83.9
/100
|
#145
Excellent
96.3%
Immigrants | Eastern Europe
83.7
/100
|
#146
Excellent
96.3%
French American Indians
83.1
/100
|
#147
Excellent
96.3%
Israelis
82.8
/100
|
#148
Excellent
96.3%
Albanians
82.6
/100
|
#149
Excellent
96.3%
Immigrants | Belarus
82.4
/100
|
#150
Excellent
96.3%
Hopi
81.6
/100
|
#151
Excellent
96.3%

Demographics Similar to Immigrants from Portugal by 7th Grade

In terms of 7th grade, the demographic groups most similar to Immigrants from Portugal are Immigrants from Guyana (94.2%, a difference of 0.020%), Cape Verdean (94.1%, a difference of 0.080%), Ecuadorian (94.0%, a difference of 0.14%), Guyanese (94.3%, a difference of 0.15%), and Immigrants from Caribbean (94.0%, a difference of 0.15%).
DemographicsRating | Rank7th Grade
Immigrants | Burma/Myanmar
0.0
/100
|
#300
Tragic
94.5%
Immigrants | Dominica
0.0
/100
|
#301
Tragic
94.5%
Immigrants | Laos
0.0
/100
|
#302
Tragic
94.5%
Sri Lankans
0.0
/100
|
#303
Tragic
94.4%
Immigrants | Haiti
0.0
/100
|
#304
Tragic
94.3%
Guyanese
0.0
/100
|
#305
Tragic
94.3%
Immigrants | Guyana
0.0
/100
|
#306
Tragic
94.2%
Immigrants | Portugal
0.0
/100
|
#307
Tragic
94.2%
Cape Verdeans
0.0
/100
|
#308
Tragic
94.1%
Ecuadorians
0.0
/100
|
#309
Tragic
94.0%
Immigrants | Caribbean
0.0
/100
|
#310
Tragic
94.0%
Puerto Ricans
0.0
/100
|
#311
Tragic
94.0%
Immigrants | Immigrants
0.0
/100
|
#312
Tragic
94.0%
Immigrants | Bangladesh
0.0
/100
|
#313
Tragic
94.0%
Japanese
0.0
/100
|
#314
Tragic
94.0%