Jamaican vs Immigrants from Latvia 7th Grade
COMPARE
Jamaican
Immigrants from Latvia
7th Grade
7th Grade Comparison
Jamaicans
Immigrants from Latvia
95.5%
7TH GRADE
2.2/ 100
METRIC RATING
239th/ 347
METRIC RANK
96.6%
7TH GRADE
97.4/ 100
METRIC RATING
111th/ 347
METRIC RANK
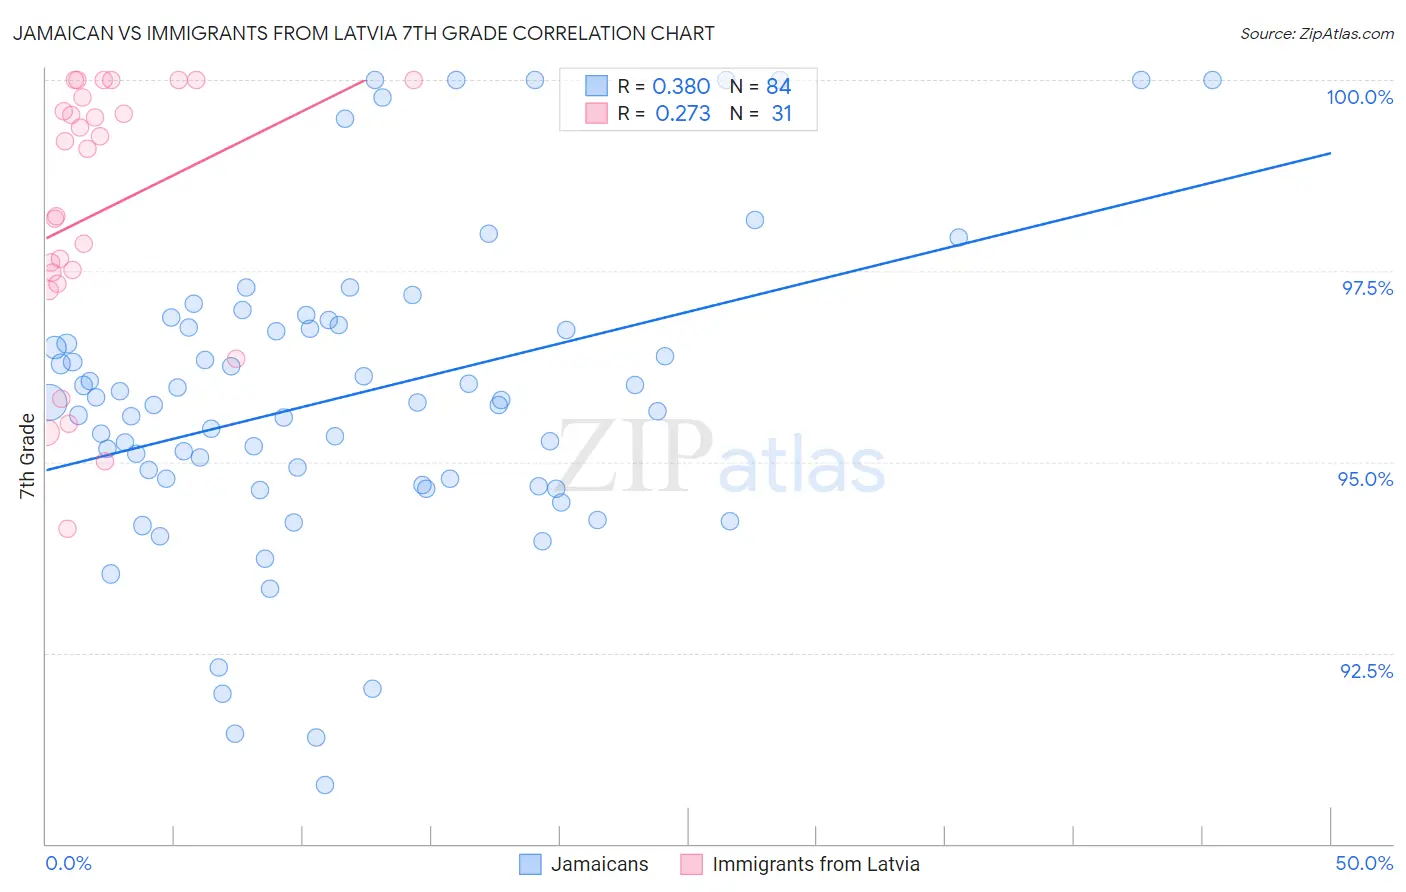
Jamaican vs Immigrants from Latvia 7th Grade Correlation Chart
The statistical analysis conducted on geographies consisting of 368,084,189 people shows a mild positive correlation between the proportion of Jamaicans and percentage of population with at least 7th grade education in the United States with a correlation coefficient (R) of 0.380 and weighted average of 95.5%. Similarly, the statistical analysis conducted on geographies consisting of 113,735,345 people shows a weak positive correlation between the proportion of Immigrants from Latvia and percentage of population with at least 7th grade education in the United States with a correlation coefficient (R) of 0.273 and weighted average of 96.6%, a difference of 1.1%.
7th Grade Correlation Summary
| Measurement | Jamaican | Immigrants from Latvia |
| Minimum | 90.8% | 94.1% |
| Maximum | 100.0% | 100.0% |
| Range | 9.2% | 5.9% |
| Mean | 95.9% | 98.3% |
| Median | 95.8% | 99.1% |
| Interquartile 25% (IQ1) | 94.7% | 97.3% |
| Interquartile 75% (IQ3) | 96.8% | 99.8% |
| Interquartile Range (IQR) | 2.0% | 2.4% |
| Standard Deviation (Sample) | 2.0% | 1.7% |
| Standard Deviation (Population) | 2.0% | 1.7% |
Similar Demographics by 7th Grade
Demographics Similar to Jamaicans by 7th Grade
In terms of 7th grade, the demographic groups most similar to Jamaicans are Immigrants from Asia (95.5%, a difference of 0.010%), Indian (Asian) (95.5%, a difference of 0.010%), Immigrants from Sierra Leone (95.5%, a difference of 0.020%), South American Indian (95.5%, a difference of 0.020%), and Immigrants from Senegal (95.5%, a difference of 0.020%).
| Demographics | Rating | Rank | 7th Grade |
| Costa Ricans | 3.3 /100 | #232 | Tragic 95.5% |
| Immigrants | Indonesia | 3.3 /100 | #233 | Tragic 95.5% |
| Nigerians | 3.0 /100 | #234 | Tragic 95.5% |
| Immigrants | Africa | 2.7 /100 | #235 | Tragic 95.5% |
| Asians | 2.6 /100 | #236 | Tragic 95.5% |
| Immigrants | Asia | 2.3 /100 | #237 | Tragic 95.5% |
| Indians (Asian) | 2.3 /100 | #238 | Tragic 95.5% |
| Jamaicans | 2.2 /100 | #239 | Tragic 95.5% |
| Immigrants | Sierra Leone | 2.0 /100 | #240 | Tragic 95.5% |
| South American Indians | 2.0 /100 | #241 | Tragic 95.5% |
| Immigrants | Senegal | 1.9 /100 | #242 | Tragic 95.5% |
| U.S. Virgin Islanders | 1.6 /100 | #243 | Tragic 95.4% |
| Uruguayans | 1.6 /100 | #244 | Tragic 95.4% |
| Immigrants | Middle Africa | 1.5 /100 | #245 | Tragic 95.4% |
| Ethiopians | 1.5 /100 | #246 | Tragic 95.4% |
Demographics Similar to Immigrants from Latvia by 7th Grade
In terms of 7th grade, the demographic groups most similar to Immigrants from Latvia are Okinawan (96.6%, a difference of 0.0%), Bhutanese (96.6%, a difference of 0.020%), Nonimmigrants (96.5%, a difference of 0.020%), Lumbee (96.6%, a difference of 0.030%), and Immigrants from Saudi Arabia (96.6%, a difference of 0.030%).
| Demographics | Rating | Rank | 7th Grade |
| Shoshone | 98.1 /100 | #104 | Exceptional 96.6% |
| South Africans | 98.0 /100 | #105 | Exceptional 96.6% |
| Iroquois | 97.9 /100 | #106 | Exceptional 96.6% |
| Lumbee | 97.8 /100 | #107 | Exceptional 96.6% |
| Immigrants | Saudi Arabia | 97.8 /100 | #108 | Exceptional 96.6% |
| Bhutanese | 97.7 /100 | #109 | Exceptional 96.6% |
| Okinawans | 97.4 /100 | #110 | Exceptional 96.6% |
| Immigrants | Latvia | 97.4 /100 | #111 | Exceptional 96.6% |
| Immigrants | Nonimmigrants | 97.0 /100 | #112 | Exceptional 96.5% |
| Pueblo | 96.8 /100 | #113 | Exceptional 96.5% |
| Immigrants | Zimbabwe | 96.6 /100 | #114 | Exceptional 96.5% |
| Choctaw | 96.6 /100 | #115 | Exceptional 96.5% |
| Syrians | 96.6 /100 | #116 | Exceptional 96.5% |
| Immigrants | Moldova | 95.7 /100 | #117 | Exceptional 96.5% |
| Immigrants | Japan | 95.5 /100 | #118 | Exceptional 96.5% |