Jamaican vs Immigrants from Portugal 6th Grade
COMPARE
Jamaican
Immigrants from Portugal
6th Grade
6th Grade Comparison
Jamaicans
Immigrants from Portugal
96.5%
6TH GRADE
0.6/ 100
METRIC RATING
253rd/ 347
METRIC RANK
95.5%
6TH GRADE
0.0/ 100
METRIC RATING
311th/ 347
METRIC RANK
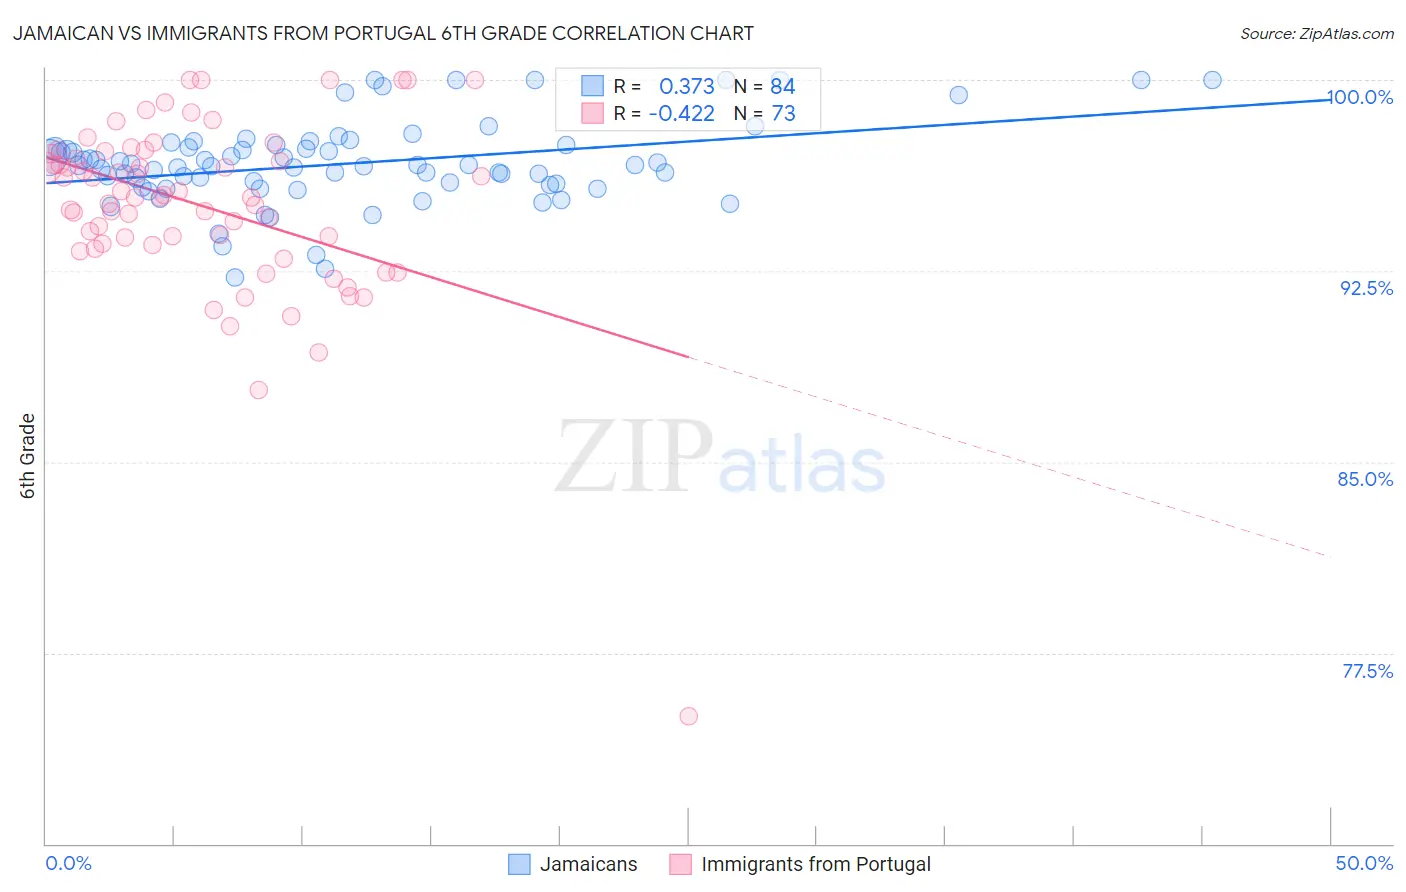
Jamaican vs Immigrants from Portugal 6th Grade Correlation Chart
The statistical analysis conducted on geographies consisting of 368,084,189 people shows a mild positive correlation between the proportion of Jamaicans and percentage of population with at least 6th grade education in the United States with a correlation coefficient (R) of 0.373 and weighted average of 96.5%. Similarly, the statistical analysis conducted on geographies consisting of 174,792,107 people shows a moderate negative correlation between the proportion of Immigrants from Portugal and percentage of population with at least 6th grade education in the United States with a correlation coefficient (R) of -0.422 and weighted average of 95.5%, a difference of 1.1%.
6th Grade Correlation Summary
| Measurement | Jamaican | Immigrants from Portugal |
| Minimum | 92.2% | 75.0% |
| Maximum | 100.0% | 100.0% |
| Range | 7.8% | 25.0% |
| Mean | 96.7% | 95.1% |
| Median | 96.6% | 95.4% |
| Interquartile 25% (IQ1) | 95.9% | 93.5% |
| Interquartile 75% (IQ3) | 97.4% | 97.2% |
| Interquartile Range (IQR) | 1.5% | 3.6% |
| Standard Deviation (Sample) | 1.6% | 3.6% |
| Standard Deviation (Population) | 1.6% | 3.6% |
Similar Demographics by 6th Grade
Demographics Similar to Jamaicans by 6th Grade
In terms of 6th grade, the demographic groups most similar to Jamaicans are Immigrants from Ethiopia (96.5%, a difference of 0.0%), Immigrants from Senegal (96.5%, a difference of 0.010%), Immigrants from Uruguay (96.5%, a difference of 0.010%), Immigrants from Congo (96.5%, a difference of 0.010%), and U.S. Virgin Islander (96.5%, a difference of 0.010%).
| Demographics | Rating | Rank | 6th Grade |
| Immigrants | Africa | 1.3 /100 | #246 | Tragic 96.6% |
| Bolivians | 1.0 /100 | #247 | Tragic 96.5% |
| Tohono O'odham | 1.0 /100 | #248 | Tragic 96.5% |
| Colombians | 0.9 /100 | #249 | Tragic 96.5% |
| Immigrants | Middle Africa | 0.8 /100 | #250 | Tragic 96.5% |
| Immigrants | Senegal | 0.7 /100 | #251 | Tragic 96.5% |
| Immigrants | Uruguay | 0.6 /100 | #252 | Tragic 96.5% |
| Jamaicans | 0.6 /100 | #253 | Tragic 96.5% |
| Immigrants | Ethiopia | 0.6 /100 | #254 | Tragic 96.5% |
| Immigrants | Congo | 0.6 /100 | #255 | Tragic 96.5% |
| U.S. Virgin Islanders | 0.5 /100 | #256 | Tragic 96.5% |
| Taiwanese | 0.5 /100 | #257 | Tragic 96.5% |
| Immigrants | China | 0.4 /100 | #258 | Tragic 96.4% |
| South Americans | 0.4 /100 | #259 | Tragic 96.4% |
| Peruvians | 0.4 /100 | #260 | Tragic 96.4% |
Demographics Similar to Immigrants from Portugal by 6th Grade
In terms of 6th grade, the demographic groups most similar to Immigrants from Portugal are Immigrants from Guyana (95.5%, a difference of 0.010%), Ecuadorian (95.5%, a difference of 0.020%), Puerto Rican (95.5%, a difference of 0.030%), Immigrants from Caribbean (95.6%, a difference of 0.080%), and Guyanese (95.6%, a difference of 0.090%).
| Demographics | Rating | Rank | 6th Grade |
| Indonesians | 0.0 /100 | #304 | Tragic 95.6% |
| Immigrants | Cuba | 0.0 /100 | #305 | Tragic 95.6% |
| Immigrants | Haiti | 0.0 /100 | #306 | Tragic 95.6% |
| Guyanese | 0.0 /100 | #307 | Tragic 95.6% |
| Immigrants | Caribbean | 0.0 /100 | #308 | Tragic 95.6% |
| Puerto Ricans | 0.0 /100 | #309 | Tragic 95.5% |
| Ecuadorians | 0.0 /100 | #310 | Tragic 95.5% |
| Immigrants | Portugal | 0.0 /100 | #311 | Tragic 95.5% |
| Immigrants | Guyana | 0.0 /100 | #312 | Tragic 95.5% |
| Nicaraguans | 0.0 /100 | #313 | Tragic 95.4% |
| Immigrants | Vietnam | 0.0 /100 | #314 | Tragic 95.4% |
| Immigrants | Bangladesh | 0.0 /100 | #315 | Tragic 95.4% |
| Japanese | 0.0 /100 | #316 | Tragic 95.4% |
| Vietnamese | 0.0 /100 | #317 | Tragic 95.3% |
| Belizeans | 0.0 /100 | #318 | Tragic 95.3% |