Jamaican vs Immigrants from Portugal 8th Grade
COMPARE
Jamaican
Immigrants from Portugal
8th Grade
8th Grade Comparison
Jamaicans
Immigrants from Portugal
95.1%
8TH GRADE
1.4/ 100
METRIC RATING
245th/ 347
METRIC RANK
93.8%
8TH GRADE
0.0/ 100
METRIC RATING
307th/ 347
METRIC RANK
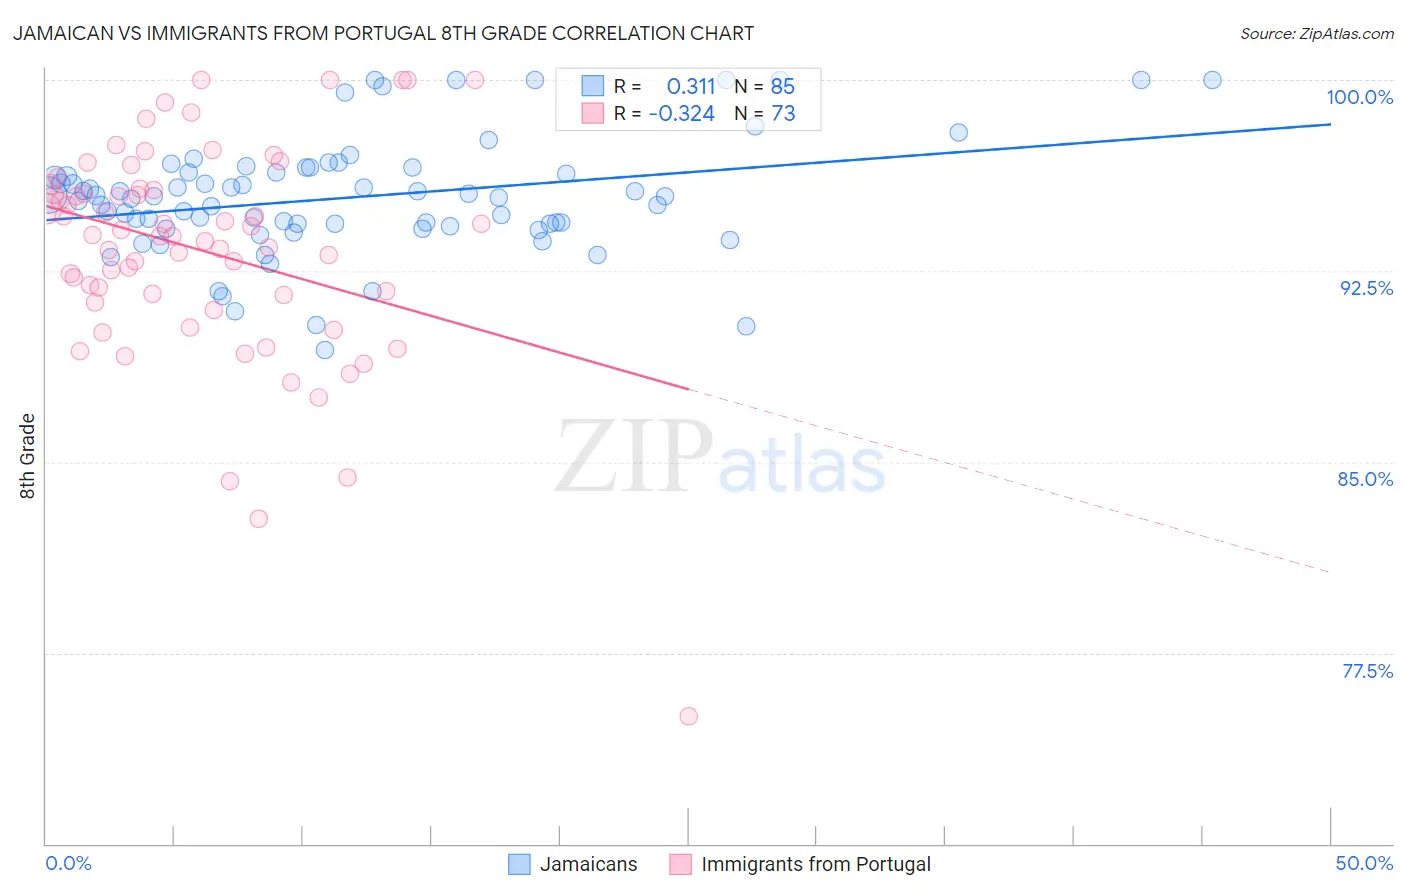
Jamaican vs Immigrants from Portugal 8th Grade Correlation Chart
The statistical analysis conducted on geographies consisting of 368,084,732 people shows a mild positive correlation between the proportion of Jamaicans and percentage of population with at least 8th grade education in the United States with a correlation coefficient (R) of 0.311 and weighted average of 95.1%. Similarly, the statistical analysis conducted on geographies consisting of 174,792,107 people shows a mild negative correlation between the proportion of Immigrants from Portugal and percentage of population with at least 8th grade education in the United States with a correlation coefficient (R) of -0.324 and weighted average of 93.8%, a difference of 1.4%.
8th Grade Correlation Summary
| Measurement | Jamaican | Immigrants from Portugal |
| Minimum | 89.4% | 75.0% |
| Maximum | 100.0% | 100.0% |
| Range | 10.6% | 25.0% |
| Mean | 95.4% | 93.3% |
| Median | 95.4% | 93.8% |
| Interquartile 25% (IQ1) | 94.3% | 91.4% |
| Interquartile 75% (IQ3) | 96.5% | 95.7% |
| Interquartile Range (IQR) | 2.2% | 4.3% |
| Standard Deviation (Sample) | 2.3% | 4.3% |
| Standard Deviation (Population) | 2.3% | 4.3% |
Similar Demographics by 8th Grade
Demographics Similar to Jamaicans by 8th Grade
In terms of 8th grade, the demographic groups most similar to Jamaicans are Somali (95.1%, a difference of 0.010%), Immigrants from Senegal (95.1%, a difference of 0.010%), Uruguayan (95.1%, a difference of 0.020%), Tongan (95.1%, a difference of 0.030%), and Paiute (95.1%, a difference of 0.030%).
| Demographics | Rating | Rank | 8th Grade |
| Natives/Alaskans | 2.3 /100 | #238 | Tragic 95.2% |
| Immigrants | Sierra Leone | 2.1 /100 | #239 | Tragic 95.1% |
| Ethiopians | 2.0 /100 | #240 | Tragic 95.1% |
| South American Indians | 1.9 /100 | #241 | Tragic 95.1% |
| Tongans | 1.7 /100 | #242 | Tragic 95.1% |
| Paiute | 1.7 /100 | #243 | Tragic 95.1% |
| Immigrants | Middle Africa | 1.7 /100 | #244 | Tragic 95.1% |
| Jamaicans | 1.4 /100 | #245 | Tragic 95.1% |
| Somalis | 1.4 /100 | #246 | Tragic 95.1% |
| Immigrants | Senegal | 1.4 /100 | #247 | Tragic 95.1% |
| Uruguayans | 1.2 /100 | #248 | Tragic 95.1% |
| Immigrants | China | 1.1 /100 | #249 | Tragic 95.0% |
| Koreans | 1.1 /100 | #250 | Tragic 95.0% |
| Bolivians | 1.0 /100 | #251 | Tragic 95.0% |
| Immigrants | Ethiopia | 1.0 /100 | #252 | Tragic 95.0% |
Demographics Similar to Immigrants from Portugal by 8th Grade
In terms of 8th grade, the demographic groups most similar to Immigrants from Portugal are Immigrants from Guyana (93.8%, a difference of 0.010%), Immigrants from Haiti (93.9%, a difference of 0.11%), Guyanese (93.9%, a difference of 0.14%), Ecuadorian (93.6%, a difference of 0.17%), and Immigrants (93.6%, a difference of 0.19%).
| Demographics | Rating | Rank | 8th Grade |
| Immigrants | Burma/Myanmar | 0.0 /100 | #300 | Tragic 94.1% |
| Immigrants | Laos | 0.0 /100 | #301 | Tragic 94.1% |
| Sri Lankans | 0.0 /100 | #302 | Tragic 94.0% |
| Immigrants | Dominica | 0.0 /100 | #303 | Tragic 94.0% |
| Guyanese | 0.0 /100 | #304 | Tragic 93.9% |
| Immigrants | Haiti | 0.0 /100 | #305 | Tragic 93.9% |
| Immigrants | Guyana | 0.0 /100 | #306 | Tragic 93.8% |
| Immigrants | Portugal | 0.0 /100 | #307 | Tragic 93.8% |
| Ecuadorians | 0.0 /100 | #308 | Tragic 93.6% |
| Immigrants | Immigrants | 0.0 /100 | #309 | Tragic 93.6% |
| Japanese | 0.0 /100 | #310 | Tragic 93.6% |
| Immigrants | Bangladesh | 0.0 /100 | #311 | Tragic 93.6% |
| Cape Verdeans | 0.0 /100 | #312 | Tragic 93.5% |
| Immigrants | Caribbean | 0.0 /100 | #313 | Tragic 93.5% |
| Immigrants | Vietnam | 0.0 /100 | #314 | Tragic 93.5% |