Jamaican vs Immigrants from Indonesia 6th Grade
COMPARE
Jamaican
Immigrants from Indonesia
6th Grade
6th Grade Comparison
Jamaicans
Immigrants from Indonesia
96.5%
6TH GRADE
0.6/ 100
METRIC RATING
253rd/ 347
METRIC RANK
96.6%
6TH GRADE
2.3/ 100
METRIC RATING
236th/ 347
METRIC RANK
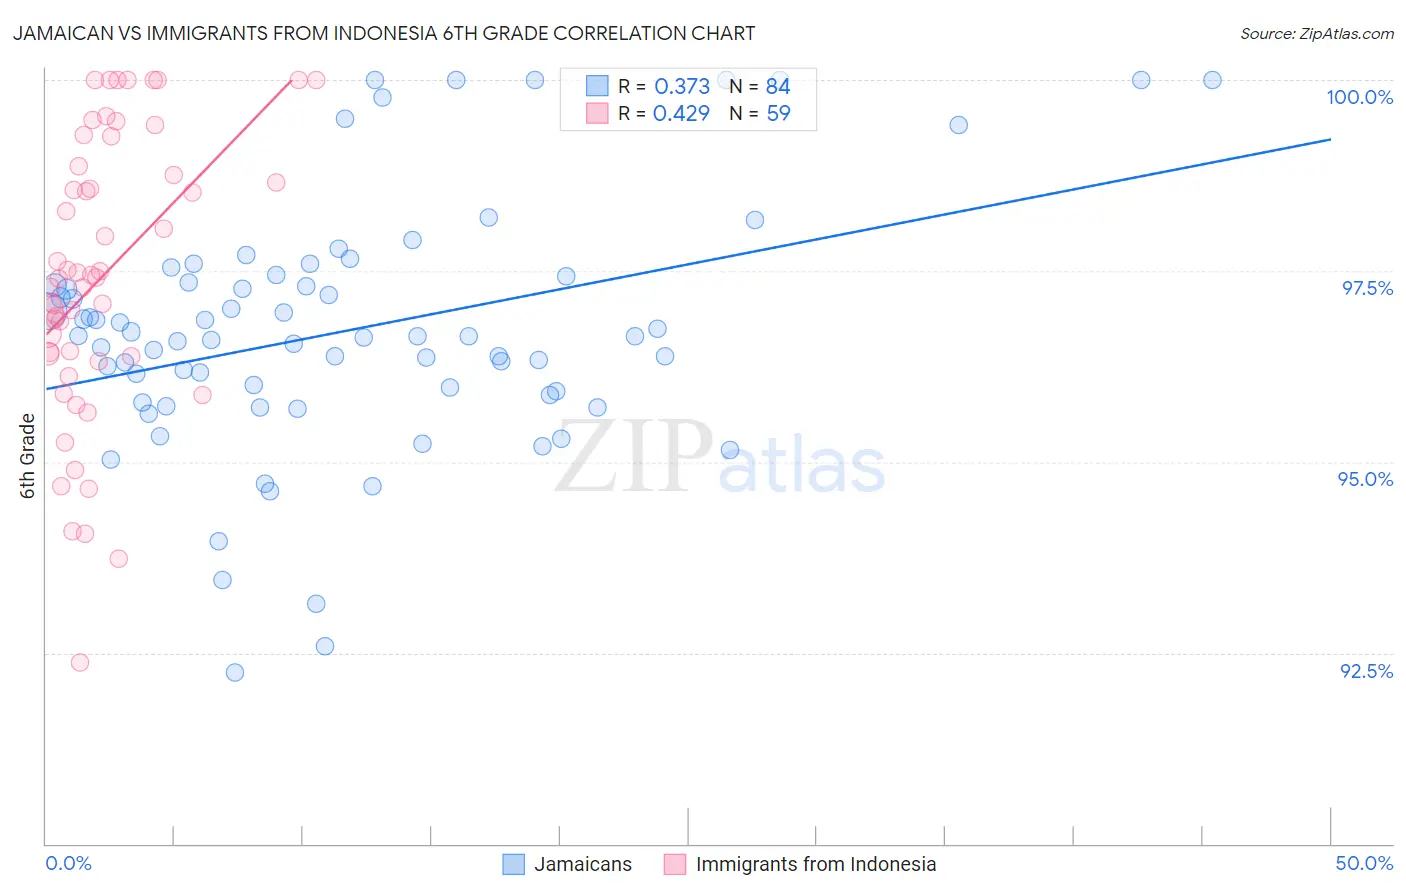
Jamaican vs Immigrants from Indonesia 6th Grade Correlation Chart
The statistical analysis conducted on geographies consisting of 368,084,189 people shows a mild positive correlation between the proportion of Jamaicans and percentage of population with at least 6th grade education in the United States with a correlation coefficient (R) of 0.373 and weighted average of 96.5%. Similarly, the statistical analysis conducted on geographies consisting of 215,782,971 people shows a moderate positive correlation between the proportion of Immigrants from Indonesia and percentage of population with at least 6th grade education in the United States with a correlation coefficient (R) of 0.429 and weighted average of 96.6%, a difference of 0.15%.
6th Grade Correlation Summary
| Measurement | Jamaican | Immigrants from Indonesia |
| Minimum | 92.2% | 92.4% |
| Maximum | 100.0% | 100.0% |
| Range | 7.8% | 7.6% |
| Mean | 96.7% | 97.4% |
| Median | 96.6% | 97.4% |
| Interquartile 25% (IQ1) | 95.9% | 96.4% |
| Interquartile 75% (IQ3) | 97.4% | 98.9% |
| Interquartile Range (IQR) | 1.5% | 2.5% |
| Standard Deviation (Sample) | 1.6% | 1.8% |
| Standard Deviation (Population) | 1.6% | 1.8% |
Demographics Similar to Jamaicans and Immigrants from Indonesia by 6th Grade
In terms of 6th grade, the demographic groups most similar to Jamaicans are Immigrants from Ethiopia (96.5%, a difference of 0.0%), Immigrants from Senegal (96.5%, a difference of 0.010%), Immigrants from Uruguay (96.5%, a difference of 0.010%), Immigrants from Middle Africa (96.5%, a difference of 0.030%), and Tohono O'odham (96.5%, a difference of 0.050%). Similarly, the demographic groups most similar to Immigrants from Indonesia are Uruguayan (96.6%, a difference of 0.010%), Asian (96.6%, a difference of 0.010%), Immigrants from Eastern Africa (96.6%, a difference of 0.010%), Nigerian (96.6%, a difference of 0.020%), and Indian (Asian) (96.6%, a difference of 0.020%).
| Demographics | Rating | Rank | 6th Grade |
| Uruguayans | 2.5 /100 | #234 | Tragic 96.6% |
| Asians | 2.4 /100 | #235 | Tragic 96.6% |
| Immigrants | Indonesia | 2.3 /100 | #236 | Tragic 96.6% |
| Immigrants | Eastern Africa | 2.0 /100 | #237 | Tragic 96.6% |
| Nigerians | 1.9 /100 | #238 | Tragic 96.6% |
| Indians (Asian) | 1.9 /100 | #239 | Tragic 96.6% |
| Koreans | 1.9 /100 | #240 | Tragic 96.6% |
| Senegalese | 1.8 /100 | #241 | Tragic 96.6% |
| Immigrants | Asia | 1.8 /100 | #242 | Tragic 96.6% |
| Immigrants | Liberia | 1.6 /100 | #243 | Tragic 96.6% |
| Ethiopians | 1.5 /100 | #244 | Tragic 96.6% |
| Immigrants | Costa Rica | 1.3 /100 | #245 | Tragic 96.6% |
| Immigrants | Africa | 1.3 /100 | #246 | Tragic 96.6% |
| Bolivians | 1.0 /100 | #247 | Tragic 96.5% |
| Tohono O'odham | 1.0 /100 | #248 | Tragic 96.5% |
| Colombians | 0.9 /100 | #249 | Tragic 96.5% |
| Immigrants | Middle Africa | 0.8 /100 | #250 | Tragic 96.5% |
| Immigrants | Senegal | 0.7 /100 | #251 | Tragic 96.5% |
| Immigrants | Uruguay | 0.6 /100 | #252 | Tragic 96.5% |
| Jamaicans | 0.6 /100 | #253 | Tragic 96.5% |
| Immigrants | Ethiopia | 0.6 /100 | #254 | Tragic 96.5% |