Jamaican vs Immigrants from Oceania 6th Grade
COMPARE
Jamaican
Immigrants from Oceania
6th Grade
6th Grade Comparison
Jamaicans
Immigrants from Oceania
96.5%
6TH GRADE
0.6/ 100
METRIC RATING
253rd/ 347
METRIC RANK
96.8%
6TH GRADE
11.0/ 100
METRIC RATING
209th/ 347
METRIC RANK
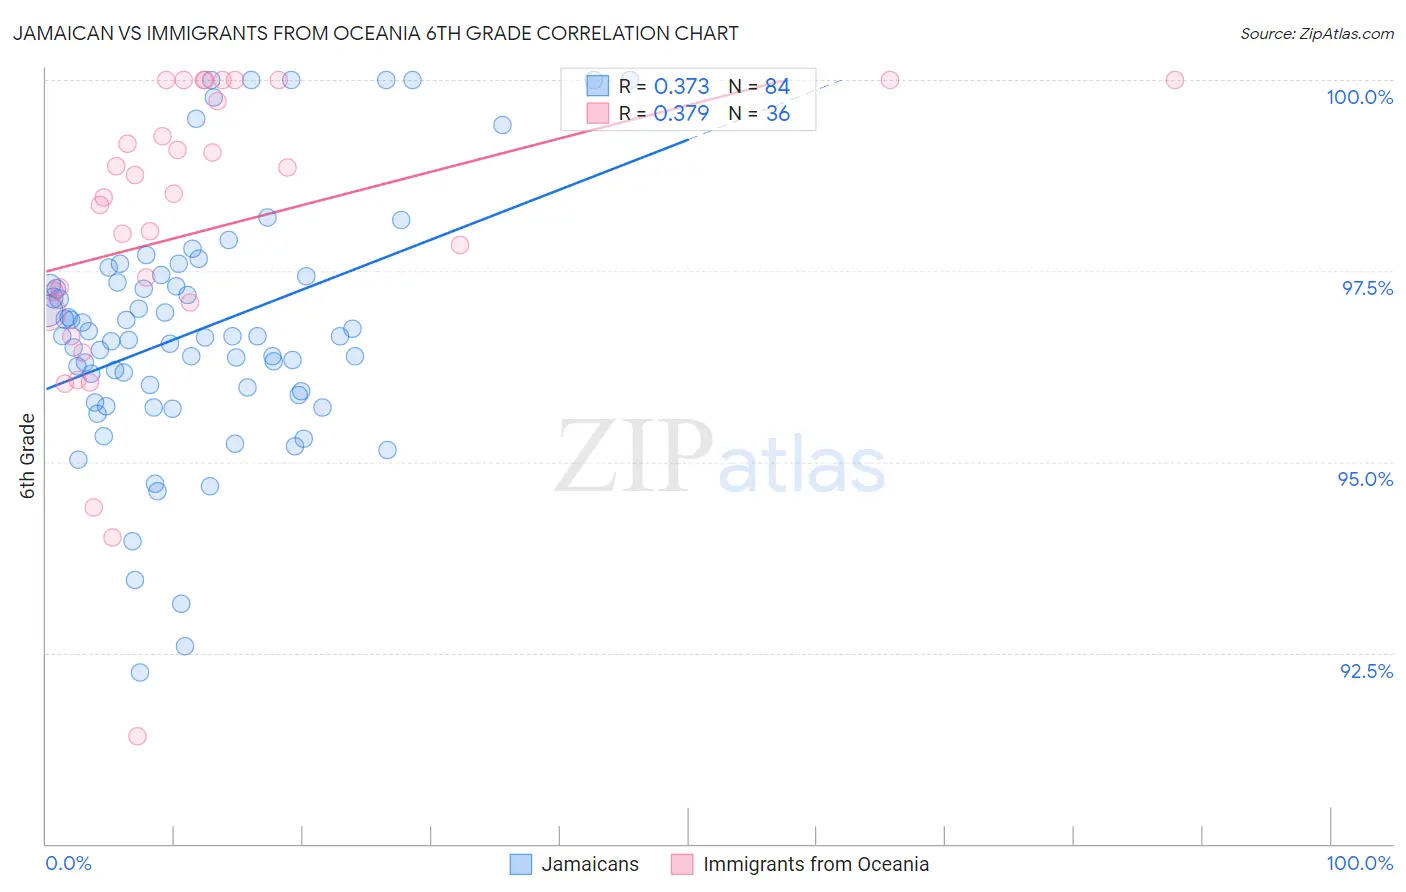
Jamaican vs Immigrants from Oceania 6th Grade Correlation Chart
The statistical analysis conducted on geographies consisting of 368,084,189 people shows a mild positive correlation between the proportion of Jamaicans and percentage of population with at least 6th grade education in the United States with a correlation coefficient (R) of 0.373 and weighted average of 96.5%. Similarly, the statistical analysis conducted on geographies consisting of 305,516,300 people shows a mild positive correlation between the proportion of Immigrants from Oceania and percentage of population with at least 6th grade education in the United States with a correlation coefficient (R) of 0.379 and weighted average of 96.8%, a difference of 0.34%.
6th Grade Correlation Summary
| Measurement | Jamaican | Immigrants from Oceania |
| Minimum | 92.2% | 91.4% |
| Maximum | 100.0% | 100.0% |
| Range | 7.8% | 8.6% |
| Mean | 96.7% | 98.0% |
| Median | 96.6% | 98.5% |
| Interquartile 25% (IQ1) | 95.9% | 97.0% |
| Interquartile 75% (IQ3) | 97.4% | 99.9% |
| Interquartile Range (IQR) | 1.5% | 2.8% |
| Standard Deviation (Sample) | 1.6% | 2.0% |
| Standard Deviation (Population) | 1.6% | 2.0% |
Similar Demographics by 6th Grade
Demographics Similar to Jamaicans by 6th Grade
In terms of 6th grade, the demographic groups most similar to Jamaicans are Immigrants from Ethiopia (96.5%, a difference of 0.0%), Immigrants from Senegal (96.5%, a difference of 0.010%), Immigrants from Uruguay (96.5%, a difference of 0.010%), Immigrants from Congo (96.5%, a difference of 0.010%), and U.S. Virgin Islander (96.5%, a difference of 0.010%).
| Demographics | Rating | Rank | 6th Grade |
| Immigrants | Africa | 1.3 /100 | #246 | Tragic 96.6% |
| Bolivians | 1.0 /100 | #247 | Tragic 96.5% |
| Tohono O'odham | 1.0 /100 | #248 | Tragic 96.5% |
| Colombians | 0.9 /100 | #249 | Tragic 96.5% |
| Immigrants | Middle Africa | 0.8 /100 | #250 | Tragic 96.5% |
| Immigrants | Senegal | 0.7 /100 | #251 | Tragic 96.5% |
| Immigrants | Uruguay | 0.6 /100 | #252 | Tragic 96.5% |
| Jamaicans | 0.6 /100 | #253 | Tragic 96.5% |
| Immigrants | Ethiopia | 0.6 /100 | #254 | Tragic 96.5% |
| Immigrants | Congo | 0.6 /100 | #255 | Tragic 96.5% |
| U.S. Virgin Islanders | 0.5 /100 | #256 | Tragic 96.5% |
| Taiwanese | 0.5 /100 | #257 | Tragic 96.5% |
| Immigrants | China | 0.4 /100 | #258 | Tragic 96.4% |
| South Americans | 0.4 /100 | #259 | Tragic 96.4% |
| Peruvians | 0.4 /100 | #260 | Tragic 96.4% |
Demographics Similar to Immigrants from Oceania by 6th Grade
In terms of 6th grade, the demographic groups most similar to Immigrants from Oceania are Samoan (96.8%, a difference of 0.0%), Laotian (96.8%, a difference of 0.010%), Iraqi (96.8%, a difference of 0.010%), Immigrants from Nepal (96.8%, a difference of 0.010%), and Native/Alaskan (96.8%, a difference of 0.020%).
| Demographics | Rating | Rank | 6th Grade |
| Immigrants | Chile | 14.2 /100 | #202 | Poor 96.8% |
| Sudanese | 13.9 /100 | #203 | Poor 96.8% |
| Immigrants | Bahamas | 13.8 /100 | #204 | Poor 96.8% |
| Natives/Alaskans | 13.0 /100 | #205 | Poor 96.8% |
| Laotians | 11.8 /100 | #206 | Poor 96.8% |
| Iraqis | 11.7 /100 | #207 | Poor 96.8% |
| Samoans | 11.0 /100 | #208 | Poor 96.8% |
| Immigrants | Oceania | 11.0 /100 | #209 | Poor 96.8% |
| Immigrants | Nepal | 10.1 /100 | #210 | Poor 96.8% |
| Immigrants | Iraq | 9.2 /100 | #211 | Tragic 96.8% |
| Moroccans | 9.0 /100 | #212 | Tragic 96.8% |
| Immigrants | Sudan | 8.7 /100 | #213 | Tragic 96.8% |
| Portuguese | 8.2 /100 | #214 | Tragic 96.8% |
| Sierra Leoneans | 8.0 /100 | #215 | Tragic 96.8% |
| Paiute | 7.8 /100 | #216 | Tragic 96.8% |