Bhutanese vs Immigrants from Sudan 7th Grade
COMPARE
Bhutanese
Immigrants from Sudan
7th Grade
7th Grade Comparison
Bhutanese
Immigrants from Sudan
96.6%
7TH GRADE
97.7/ 100
METRIC RATING
109th/ 347
METRIC RANK
95.8%
7TH GRADE
17.0/ 100
METRIC RATING
208th/ 347
METRIC RANK
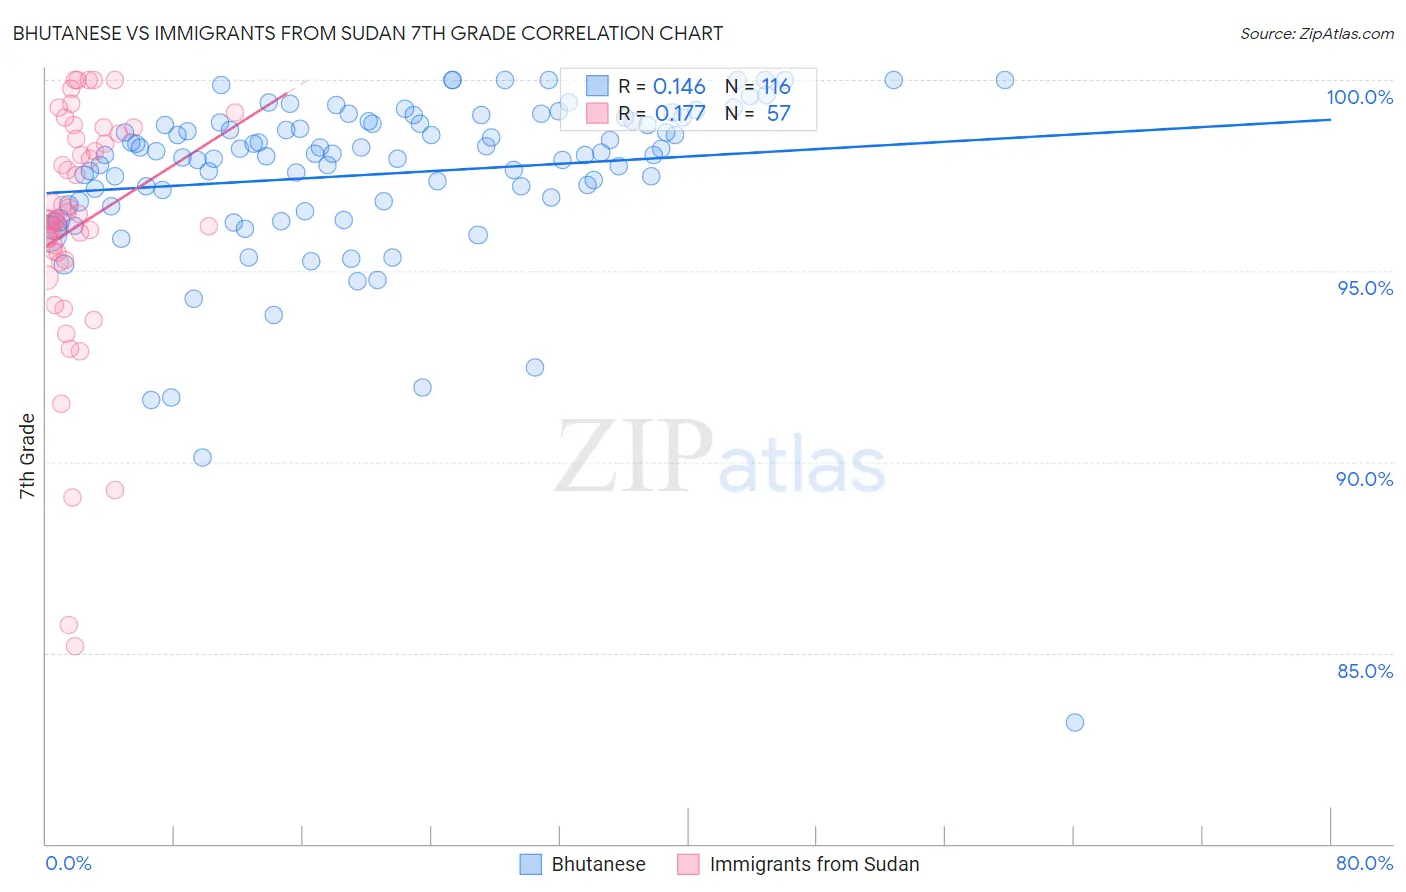
Bhutanese vs Immigrants from Sudan 7th Grade Correlation Chart
The statistical analysis conducted on geographies consisting of 455,591,134 people shows a poor positive correlation between the proportion of Bhutanese and percentage of population with at least 7th grade education in the United States with a correlation coefficient (R) of 0.146 and weighted average of 96.6%. Similarly, the statistical analysis conducted on geographies consisting of 118,959,807 people shows a poor positive correlation between the proportion of Immigrants from Sudan and percentage of population with at least 7th grade education in the United States with a correlation coefficient (R) of 0.177 and weighted average of 95.8%, a difference of 0.82%.
7th Grade Correlation Summary
| Measurement | Bhutanese | Immigrants from Sudan |
| Minimum | 83.2% | 85.2% |
| Maximum | 100.0% | 100.0% |
| Range | 16.8% | 14.8% |
| Mean | 97.5% | 96.2% |
| Median | 98.1% | 96.3% |
| Interquartile 25% (IQ1) | 96.8% | 95.4% |
| Interquartile 75% (IQ3) | 98.9% | 98.5% |
| Interquartile Range (IQR) | 2.1% | 3.1% |
| Standard Deviation (Sample) | 2.3% | 3.2% |
| Standard Deviation (Population) | 2.3% | 3.2% |
Similar Demographics by 7th Grade
Demographics Similar to Bhutanese by 7th Grade
In terms of 7th grade, the demographic groups most similar to Bhutanese are Lumbee (96.6%, a difference of 0.010%), Immigrants from Saudi Arabia (96.6%, a difference of 0.010%), Iroquois (96.6%, a difference of 0.020%), Okinawan (96.6%, a difference of 0.020%), and Immigrants from Latvia (96.6%, a difference of 0.020%).
| Demographics | Rating | Rank | 7th Grade |
| Immigrants | Czechoslovakia | 98.3 /100 | #102 | Exceptional 96.6% |
| Immigrants | Singapore | 98.3 /100 | #103 | Exceptional 96.6% |
| Shoshone | 98.1 /100 | #104 | Exceptional 96.6% |
| South Africans | 98.0 /100 | #105 | Exceptional 96.6% |
| Iroquois | 97.9 /100 | #106 | Exceptional 96.6% |
| Lumbee | 97.8 /100 | #107 | Exceptional 96.6% |
| Immigrants | Saudi Arabia | 97.8 /100 | #108 | Exceptional 96.6% |
| Bhutanese | 97.7 /100 | #109 | Exceptional 96.6% |
| Okinawans | 97.4 /100 | #110 | Exceptional 96.6% |
| Immigrants | Latvia | 97.4 /100 | #111 | Exceptional 96.6% |
| Immigrants | Nonimmigrants | 97.0 /100 | #112 | Exceptional 96.5% |
| Pueblo | 96.8 /100 | #113 | Exceptional 96.5% |
| Immigrants | Zimbabwe | 96.6 /100 | #114 | Exceptional 96.5% |
| Choctaw | 96.6 /100 | #115 | Exceptional 96.5% |
| Syrians | 96.6 /100 | #116 | Exceptional 96.5% |
Demographics Similar to Immigrants from Sudan by 7th Grade
In terms of 7th grade, the demographic groups most similar to Immigrants from Sudan are Navajo (95.8%, a difference of 0.0%), African (95.8%, a difference of 0.010%), Dutch West Indian (95.8%, a difference of 0.010%), Hawaiian (95.8%, a difference of 0.010%), and Moroccan (95.8%, a difference of 0.020%).
| Demographics | Rating | Rank | 7th Grade |
| Immigrants | Argentina | 21.9 /100 | #201 | Fair 95.9% |
| Immigrants | Northern Africa | 21.4 /100 | #202 | Fair 95.8% |
| Comanche | 21.1 /100 | #203 | Fair 95.8% |
| Assyrians/Chaldeans/Syriacs | 20.5 /100 | #204 | Fair 95.8% |
| Moroccans | 18.9 /100 | #205 | Poor 95.8% |
| Africans | 17.6 /100 | #206 | Poor 95.8% |
| Navajo | 17.0 /100 | #207 | Poor 95.8% |
| Immigrants | Sudan | 17.0 /100 | #208 | Poor 95.8% |
| Dutch West Indians | 16.1 /100 | #209 | Poor 95.8% |
| Hawaiians | 16.0 /100 | #210 | Poor 95.8% |
| Portuguese | 13.6 /100 | #211 | Poor 95.8% |
| Immigrants | Lebanon | 13.0 /100 | #212 | Poor 95.8% |
| Immigrants | Morocco | 12.6 /100 | #213 | Poor 95.8% |
| Bahamians | 11.6 /100 | #214 | Poor 95.7% |
| Spanish Americans | 9.3 /100 | #215 | Tragic 95.7% |