Italian vs Cree 7th Grade
COMPARE
Italian
Cree
7th Grade
7th Grade Comparison
Italians
Cree
97.3%
7TH GRADE
100.0/ 100
METRIC RATING
32nd/ 347
METRIC RANK
96.7%
7TH GRADE
99.0/ 100
METRIC RATING
89th/ 347
METRIC RANK
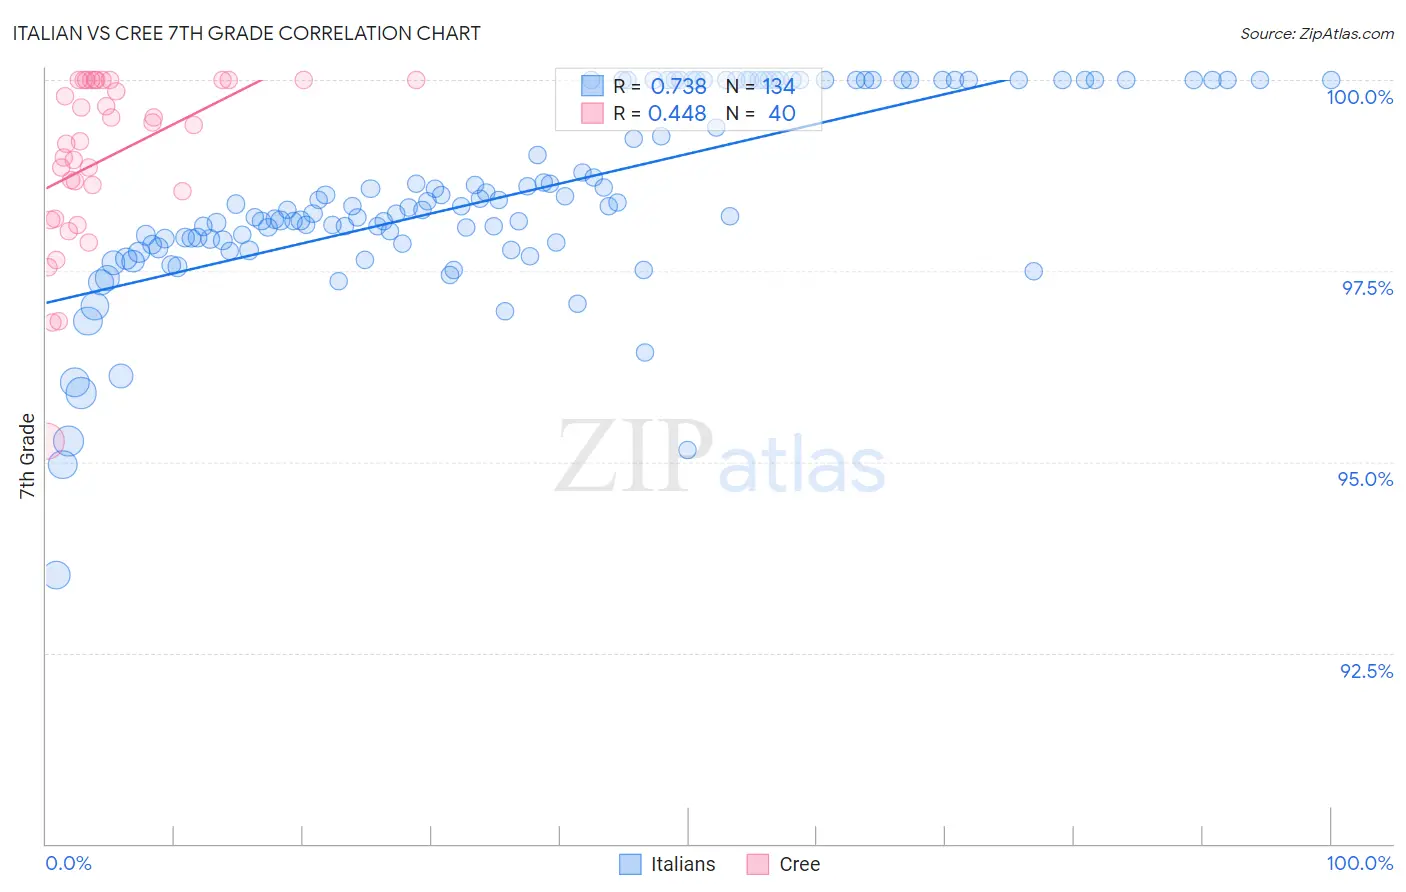
Italian vs Cree 7th Grade Correlation Chart
The statistical analysis conducted on geographies consisting of 546,284,153 people shows a strong positive correlation between the proportion of Italians and percentage of population with at least 7th grade education in the United States with a correlation coefficient (R) of 0.738 and weighted average of 97.3%. Similarly, the statistical analysis conducted on geographies consisting of 76,204,399 people shows a moderate positive correlation between the proportion of Cree and percentage of population with at least 7th grade education in the United States with a correlation coefficient (R) of 0.448 and weighted average of 96.7%, a difference of 0.64%.
7th Grade Correlation Summary
| Measurement | Italian | Cree |
| Minimum | 93.5% | 95.3% |
| Maximum | 100.0% | 100.0% |
| Range | 6.5% | 4.7% |
| Mean | 98.5% | 99.0% |
| Median | 98.3% | 99.3% |
| Interquartile 25% (IQ1) | 97.9% | 98.4% |
| Interquartile 75% (IQ3) | 100.0% | 100.0% |
| Interquartile Range (IQR) | 2.1% | 1.6% |
| Standard Deviation (Sample) | 1.2% | 1.1% |
| Standard Deviation (Population) | 1.2% | 1.1% |
Similar Demographics by 7th Grade
Demographics Similar to Italians by 7th Grade
In terms of 7th grade, the demographic groups most similar to Italians are European (97.3%, a difference of 0.0%), Chippewa (97.3%, a difference of 0.010%), Czech (97.4%, a difference of 0.020%), Sioux (97.4%, a difference of 0.030%), and Scandinavian (97.4%, a difference of 0.030%).
| Demographics | Rating | Rank | 7th Grade |
| French | 100.0 /100 | #25 | Exceptional 97.4% |
| Scotch-Irish | 100.0 /100 | #26 | Exceptional 97.4% |
| Danes | 100.0 /100 | #27 | Exceptional 97.4% |
| Sioux | 100.0 /100 | #28 | Exceptional 97.4% |
| Scandinavians | 100.0 /100 | #29 | Exceptional 97.4% |
| Czechs | 100.0 /100 | #30 | Exceptional 97.4% |
| Europeans | 100.0 /100 | #31 | Exceptional 97.3% |
| Italians | 100.0 /100 | #32 | Exceptional 97.3% |
| Chippewa | 100.0 /100 | #33 | Exceptional 97.3% |
| Alaska Natives | 100.0 /100 | #34 | Exceptional 97.3% |
| Swiss | 100.0 /100 | #35 | Exceptional 97.3% |
| Hungarians | 100.0 /100 | #36 | Exceptional 97.2% |
| British | 100.0 /100 | #37 | Exceptional 97.2% |
| Belgians | 100.0 /100 | #38 | Exceptional 97.2% |
| Latvians | 100.0 /100 | #39 | Exceptional 97.2% |
Demographics Similar to Cree by 7th Grade
In terms of 7th grade, the demographic groups most similar to Cree are Immigrants from Belgium (96.7%, a difference of 0.0%), Puget Sound Salish (96.7%, a difference of 0.0%), Turkish (96.7%, a difference of 0.010%), Immigrants from South Africa (96.7%, a difference of 0.010%), and Osage (96.7%, a difference of 0.010%).
| Demographics | Rating | Rank | 7th Grade |
| Chickasaw | 99.2 /100 | #82 | Exceptional 96.7% |
| Icelanders | 99.1 /100 | #83 | Exceptional 96.7% |
| Romanians | 99.1 /100 | #84 | Exceptional 96.7% |
| Kiowa | 99.1 /100 | #85 | Exceptional 96.7% |
| Turks | 99.1 /100 | #86 | Exceptional 96.7% |
| Immigrants | Belgium | 99.0 /100 | #87 | Exceptional 96.7% |
| Puget Sound Salish | 99.0 /100 | #88 | Exceptional 96.7% |
| Cree | 99.0 /100 | #89 | Exceptional 96.7% |
| Immigrants | South Africa | 98.9 /100 | #90 | Exceptional 96.7% |
| Osage | 98.9 /100 | #91 | Exceptional 96.7% |
| Immigrants | Western Europe | 98.9 /100 | #92 | Exceptional 96.7% |
| Potawatomi | 98.9 /100 | #93 | Exceptional 96.7% |
| Lebanese | 98.8 /100 | #94 | Exceptional 96.7% |
| Immigrants | Australia | 98.8 /100 | #95 | Exceptional 96.7% |
| Immigrants | Denmark | 98.7 /100 | #96 | Exceptional 96.7% |