Bolivian vs Immigrants from Sudan 7th Grade
COMPARE
Bolivian
Immigrants from Sudan
7th Grade
7th Grade Comparison
Bolivians
Immigrants from Sudan
95.4%
7TH GRADE
1.1/ 100
METRIC RATING
249th/ 347
METRIC RANK
95.8%
7TH GRADE
17.0/ 100
METRIC RATING
208th/ 347
METRIC RANK
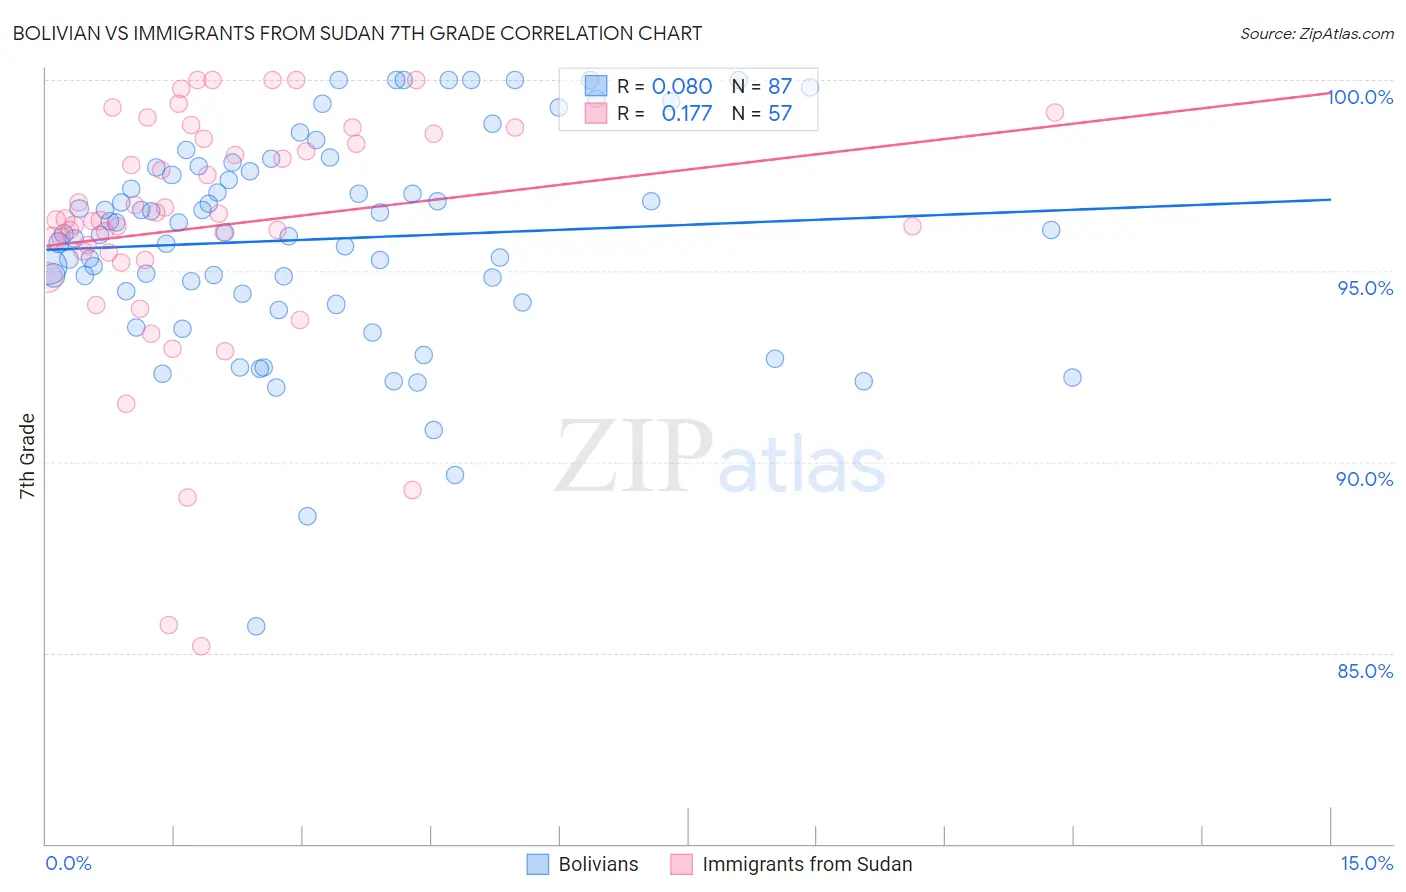
Bolivian vs Immigrants from Sudan 7th Grade Correlation Chart
The statistical analysis conducted on geographies consisting of 184,666,822 people shows a slight positive correlation between the proportion of Bolivians and percentage of population with at least 7th grade education in the United States with a correlation coefficient (R) of 0.080 and weighted average of 95.4%. Similarly, the statistical analysis conducted on geographies consisting of 118,959,807 people shows a poor positive correlation between the proportion of Immigrants from Sudan and percentage of population with at least 7th grade education in the United States with a correlation coefficient (R) of 0.177 and weighted average of 95.8%, a difference of 0.45%.
7th Grade Correlation Summary
| Measurement | Bolivian | Immigrants from Sudan |
| Minimum | 85.7% | 85.2% |
| Maximum | 100.0% | 100.0% |
| Range | 14.3% | 14.8% |
| Mean | 95.8% | 96.2% |
| Median | 96.0% | 96.3% |
| Interquartile 25% (IQ1) | 94.4% | 95.4% |
| Interquartile 75% (IQ3) | 97.7% | 98.5% |
| Interquartile Range (IQR) | 3.3% | 3.1% |
| Standard Deviation (Sample) | 2.8% | 3.2% |
| Standard Deviation (Population) | 2.8% | 3.2% |
Similar Demographics by 7th Grade
Demographics Similar to Bolivians by 7th Grade
In terms of 7th grade, the demographic groups most similar to Bolivians are Paiute (95.4%, a difference of 0.010%), Immigrants from Cameroon (95.4%, a difference of 0.020%), Immigrants from Jamaica (95.4%, a difference of 0.020%), Tongan (95.4%, a difference of 0.030%), and Immigrants from Ethiopia (95.3%, a difference of 0.030%).
| Demographics | Rating | Rank | 7th Grade |
| Immigrants | Senegal | 1.9 /100 | #242 | Tragic 95.5% |
| U.S. Virgin Islanders | 1.6 /100 | #243 | Tragic 95.4% |
| Uruguayans | 1.6 /100 | #244 | Tragic 95.4% |
| Immigrants | Middle Africa | 1.5 /100 | #245 | Tragic 95.4% |
| Ethiopians | 1.5 /100 | #246 | Tragic 95.4% |
| Tongans | 1.3 /100 | #247 | Tragic 95.4% |
| Paiute | 1.2 /100 | #248 | Tragic 95.4% |
| Bolivians | 1.1 /100 | #249 | Tragic 95.4% |
| Immigrants | Cameroon | 0.9 /100 | #250 | Tragic 95.4% |
| Immigrants | Jamaica | 0.9 /100 | #251 | Tragic 95.4% |
| Immigrants | Ethiopia | 0.9 /100 | #252 | Tragic 95.3% |
| Somalis | 0.9 /100 | #253 | Tragic 95.3% |
| Colombians | 0.8 /100 | #254 | Tragic 95.3% |
| Koreans | 0.8 /100 | #255 | Tragic 95.3% |
| Immigrants | China | 0.7 /100 | #256 | Tragic 95.3% |
Demographics Similar to Immigrants from Sudan by 7th Grade
In terms of 7th grade, the demographic groups most similar to Immigrants from Sudan are Navajo (95.8%, a difference of 0.0%), African (95.8%, a difference of 0.010%), Dutch West Indian (95.8%, a difference of 0.010%), Hawaiian (95.8%, a difference of 0.010%), and Moroccan (95.8%, a difference of 0.020%).
| Demographics | Rating | Rank | 7th Grade |
| Immigrants | Argentina | 21.9 /100 | #201 | Fair 95.9% |
| Immigrants | Northern Africa | 21.4 /100 | #202 | Fair 95.8% |
| Comanche | 21.1 /100 | #203 | Fair 95.8% |
| Assyrians/Chaldeans/Syriacs | 20.5 /100 | #204 | Fair 95.8% |
| Moroccans | 18.9 /100 | #205 | Poor 95.8% |
| Africans | 17.6 /100 | #206 | Poor 95.8% |
| Navajo | 17.0 /100 | #207 | Poor 95.8% |
| Immigrants | Sudan | 17.0 /100 | #208 | Poor 95.8% |
| Dutch West Indians | 16.1 /100 | #209 | Poor 95.8% |
| Hawaiians | 16.0 /100 | #210 | Poor 95.8% |
| Portuguese | 13.6 /100 | #211 | Poor 95.8% |
| Immigrants | Lebanon | 13.0 /100 | #212 | Poor 95.8% |
| Immigrants | Morocco | 12.6 /100 | #213 | Poor 95.8% |
| Bahamians | 11.6 /100 | #214 | Poor 95.7% |
| Spanish Americans | 9.3 /100 | #215 | Tragic 95.7% |