Filipino vs Immigrants from Sudan 7th Grade
COMPARE
Filipino
Immigrants from Sudan
7th Grade
7th Grade Comparison
Filipinos
Immigrants from Sudan
96.4%
7TH GRADE
92.1/ 100
METRIC RATING
131st/ 347
METRIC RANK
95.8%
7TH GRADE
17.0/ 100
METRIC RATING
208th/ 347
METRIC RANK
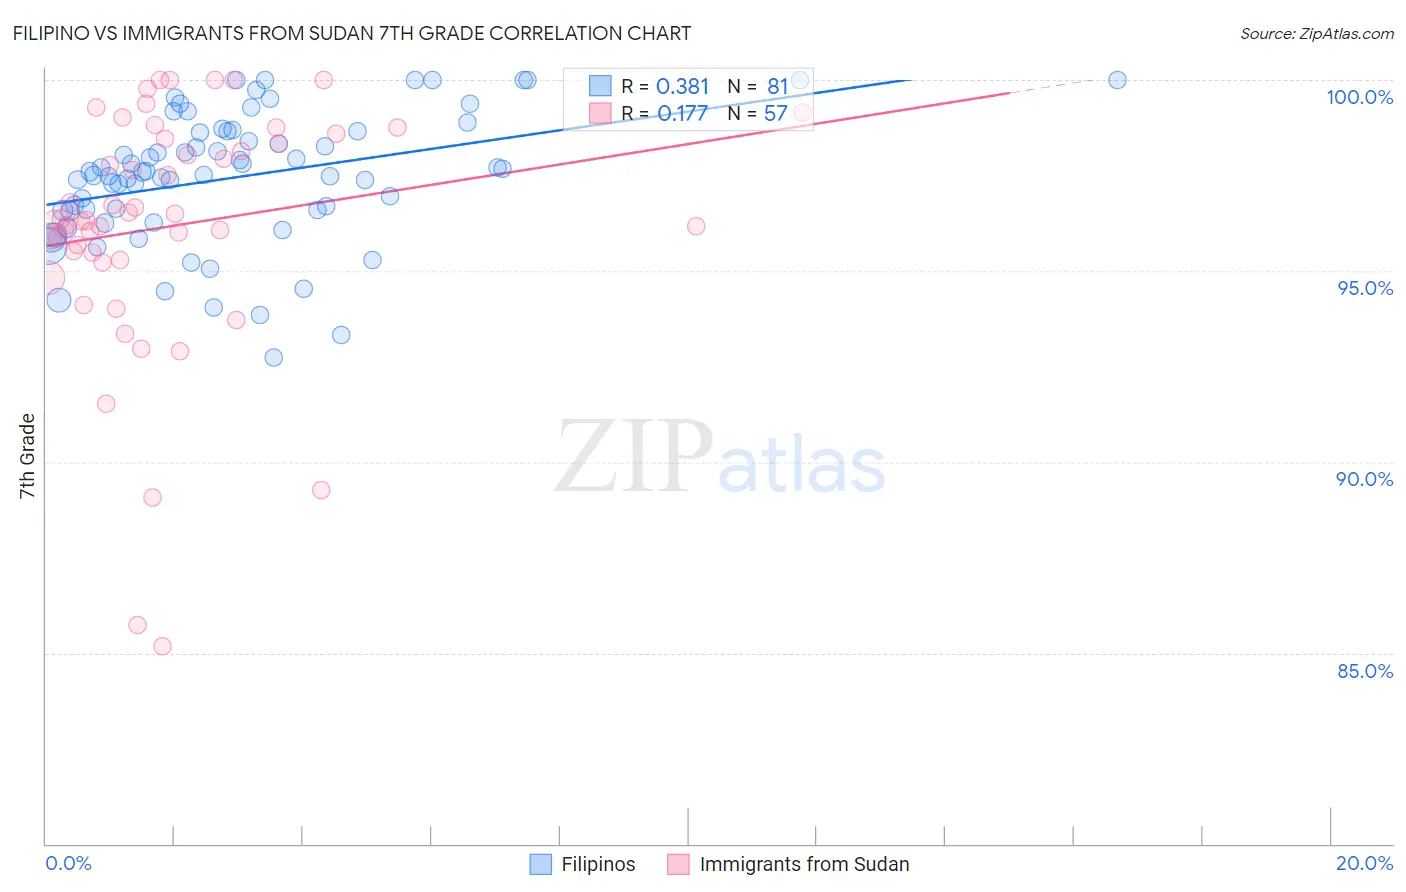
Filipino vs Immigrants from Sudan 7th Grade Correlation Chart
The statistical analysis conducted on geographies consisting of 254,351,427 people shows a mild positive correlation between the proportion of Filipinos and percentage of population with at least 7th grade education in the United States with a correlation coefficient (R) of 0.381 and weighted average of 96.4%. Similarly, the statistical analysis conducted on geographies consisting of 118,959,807 people shows a poor positive correlation between the proportion of Immigrants from Sudan and percentage of population with at least 7th grade education in the United States with a correlation coefficient (R) of 0.177 and weighted average of 95.8%, a difference of 0.62%.
7th Grade Correlation Summary
| Measurement | Filipino | Immigrants from Sudan |
| Minimum | 92.7% | 85.2% |
| Maximum | 100.0% | 100.0% |
| Range | 7.3% | 14.8% |
| Mean | 97.5% | 96.2% |
| Median | 97.6% | 96.3% |
| Interquartile 25% (IQ1) | 96.6% | 95.4% |
| Interquartile 75% (IQ3) | 98.7% | 98.5% |
| Interquartile Range (IQR) | 2.1% | 3.1% |
| Standard Deviation (Sample) | 1.7% | 3.2% |
| Standard Deviation (Population) | 1.7% | 3.2% |
Similar Demographics by 7th Grade
Demographics Similar to Filipinos by 7th Grade
In terms of 7th grade, the demographic groups most similar to Filipinos are Colville (96.4%, a difference of 0.010%), Hmong (96.4%, a difference of 0.010%), Immigrants from Romania (96.4%, a difference of 0.020%), Immigrants from North Macedonia (96.4%, a difference of 0.020%), and Immigrants from Serbia (96.4%, a difference of 0.020%).
| Demographics | Rating | Rank | 7th Grade |
| Immigrants | Switzerland | 94.5 /100 | #124 | Exceptional 96.5% |
| Immigrants | Bulgaria | 94.0 /100 | #125 | Exceptional 96.4% |
| Palestinians | 93.5 /100 | #126 | Exceptional 96.4% |
| Immigrants | Bosnia and Herzegovina | 93.3 /100 | #127 | Exceptional 96.4% |
| Immigrants | Romania | 93.2 /100 | #128 | Exceptional 96.4% |
| Immigrants | North Macedonia | 93.1 /100 | #129 | Exceptional 96.4% |
| Immigrants | Serbia | 92.8 /100 | #130 | Exceptional 96.4% |
| Filipinos | 92.1 /100 | #131 | Exceptional 96.4% |
| Colville | 91.7 /100 | #132 | Exceptional 96.4% |
| Hmong | 91.5 /100 | #133 | Exceptional 96.4% |
| Soviet Union | 91.2 /100 | #134 | Exceptional 96.4% |
| Immigrants | Kuwait | 91.1 /100 | #135 | Exceptional 96.4% |
| Immigrants | Hungary | 90.6 /100 | #136 | Exceptional 96.4% |
| Immigrants | Turkey | 90.2 /100 | #137 | Exceptional 96.4% |
| Jordanians | 90.0 /100 | #138 | Excellent 96.4% |
Demographics Similar to Immigrants from Sudan by 7th Grade
In terms of 7th grade, the demographic groups most similar to Immigrants from Sudan are Navajo (95.8%, a difference of 0.0%), African (95.8%, a difference of 0.010%), Dutch West Indian (95.8%, a difference of 0.010%), Hawaiian (95.8%, a difference of 0.010%), and Moroccan (95.8%, a difference of 0.020%).
| Demographics | Rating | Rank | 7th Grade |
| Immigrants | Argentina | 21.9 /100 | #201 | Fair 95.9% |
| Immigrants | Northern Africa | 21.4 /100 | #202 | Fair 95.8% |
| Comanche | 21.1 /100 | #203 | Fair 95.8% |
| Assyrians/Chaldeans/Syriacs | 20.5 /100 | #204 | Fair 95.8% |
| Moroccans | 18.9 /100 | #205 | Poor 95.8% |
| Africans | 17.6 /100 | #206 | Poor 95.8% |
| Navajo | 17.0 /100 | #207 | Poor 95.8% |
| Immigrants | Sudan | 17.0 /100 | #208 | Poor 95.8% |
| Dutch West Indians | 16.1 /100 | #209 | Poor 95.8% |
| Hawaiians | 16.0 /100 | #210 | Poor 95.8% |
| Portuguese | 13.6 /100 | #211 | Poor 95.8% |
| Immigrants | Lebanon | 13.0 /100 | #212 | Poor 95.8% |
| Immigrants | Morocco | 12.6 /100 | #213 | Poor 95.8% |
| Bahamians | 11.6 /100 | #214 | Poor 95.7% |
| Spanish Americans | 9.3 /100 | #215 | Tragic 95.7% |