Italian vs Alsatian 7th Grade
COMPARE
Italian
Alsatian
7th Grade
7th Grade Comparison
Italians
Alsatians
97.3%
7TH GRADE
100.0/ 100
METRIC RATING
32nd/ 347
METRIC RANK
96.1%
7TH GRADE
67.2/ 100
METRIC RATING
159th/ 347
METRIC RANK
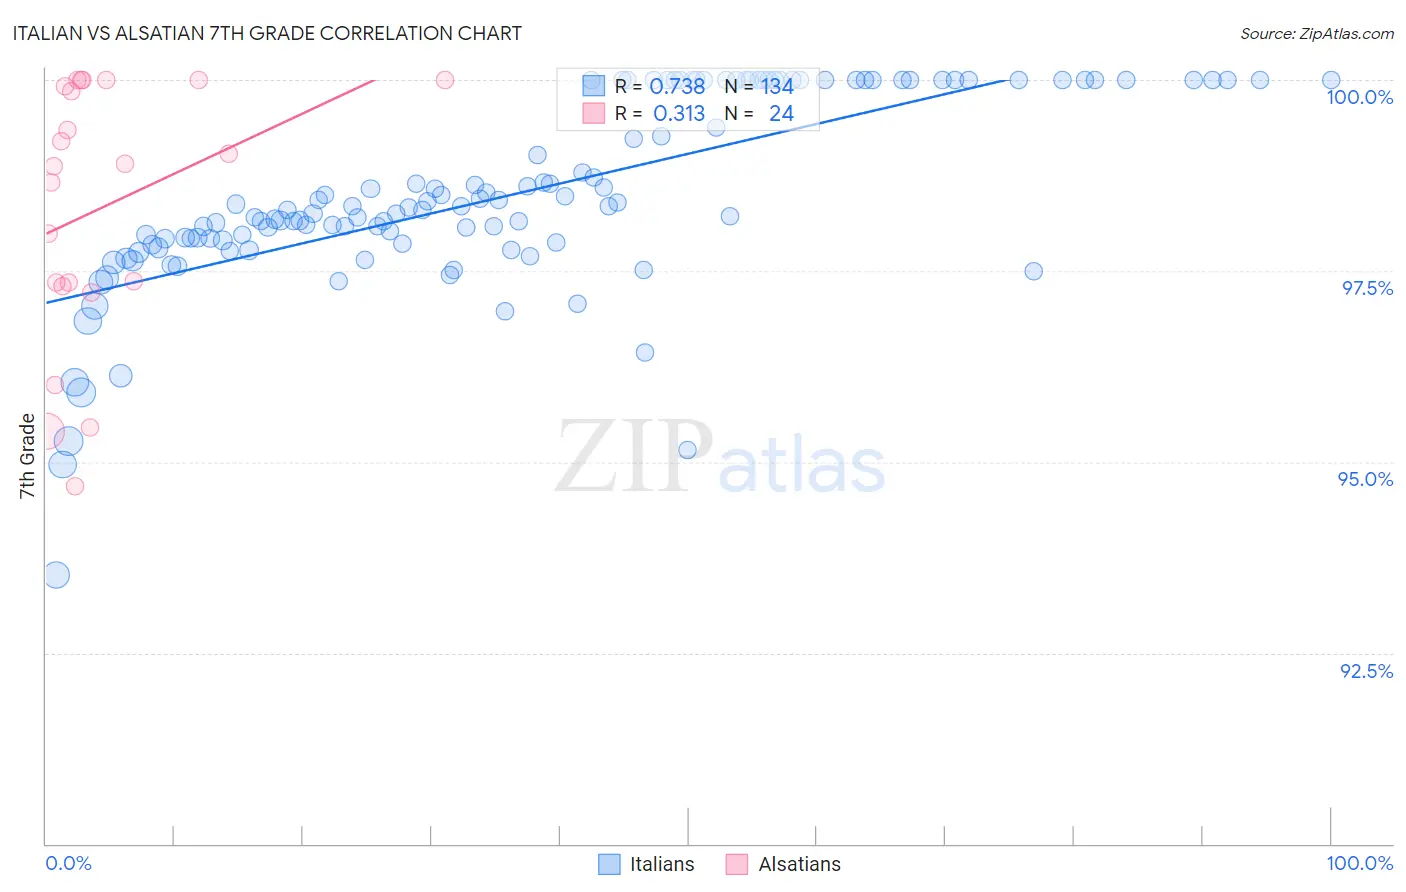
Italian vs Alsatian 7th Grade Correlation Chart
The statistical analysis conducted on geographies consisting of 546,284,153 people shows a strong positive correlation between the proportion of Italians and percentage of population with at least 7th grade education in the United States with a correlation coefficient (R) of 0.738 and weighted average of 97.3%. Similarly, the statistical analysis conducted on geographies consisting of 82,676,581 people shows a mild positive correlation between the proportion of Alsatians and percentage of population with at least 7th grade education in the United States with a correlation coefficient (R) of 0.313 and weighted average of 96.1%, a difference of 1.2%.
7th Grade Correlation Summary
| Measurement | Italian | Alsatian |
| Minimum | 93.5% | 94.7% |
| Maximum | 100.0% | 100.0% |
| Range | 6.5% | 5.3% |
| Mean | 98.5% | 98.3% |
| Median | 98.3% | 98.9% |
| Interquartile 25% (IQ1) | 97.9% | 97.3% |
| Interquartile 75% (IQ3) | 100.0% | 100.0% |
| Interquartile Range (IQR) | 2.1% | 2.6% |
| Standard Deviation (Sample) | 1.2% | 1.7% |
| Standard Deviation (Population) | 1.2% | 1.7% |
Similar Demographics by 7th Grade
Demographics Similar to Italians by 7th Grade
In terms of 7th grade, the demographic groups most similar to Italians are European (97.3%, a difference of 0.0%), Chippewa (97.3%, a difference of 0.010%), Czech (97.4%, a difference of 0.020%), Sioux (97.4%, a difference of 0.030%), and Scandinavian (97.4%, a difference of 0.030%).
| Demographics | Rating | Rank | 7th Grade |
| French | 100.0 /100 | #25 | Exceptional 97.4% |
| Scotch-Irish | 100.0 /100 | #26 | Exceptional 97.4% |
| Danes | 100.0 /100 | #27 | Exceptional 97.4% |
| Sioux | 100.0 /100 | #28 | Exceptional 97.4% |
| Scandinavians | 100.0 /100 | #29 | Exceptional 97.4% |
| Czechs | 100.0 /100 | #30 | Exceptional 97.4% |
| Europeans | 100.0 /100 | #31 | Exceptional 97.3% |
| Italians | 100.0 /100 | #32 | Exceptional 97.3% |
| Chippewa | 100.0 /100 | #33 | Exceptional 97.3% |
| Alaska Natives | 100.0 /100 | #34 | Exceptional 97.3% |
| Swiss | 100.0 /100 | #35 | Exceptional 97.3% |
| Hungarians | 100.0 /100 | #36 | Exceptional 97.2% |
| British | 100.0 /100 | #37 | Exceptional 97.2% |
| Belgians | 100.0 /100 | #38 | Exceptional 97.2% |
| Latvians | 100.0 /100 | #39 | Exceptional 97.2% |
Demographics Similar to Alsatians by 7th Grade
In terms of 7th grade, the demographic groups most similar to Alsatians are Immigrants from Kenya (96.1%, a difference of 0.0%), Arab (96.2%, a difference of 0.010%), Bermudan (96.1%, a difference of 0.010%), Pima (96.1%, a difference of 0.020%), and Spaniard (96.1%, a difference of 0.030%).
| Demographics | Rating | Rank | 7th Grade |
| Immigrants | Russia | 78.4 /100 | #152 | Good 96.2% |
| Seminole | 78.1 /100 | #153 | Good 96.2% |
| Immigrants | Israel | 77.6 /100 | #154 | Good 96.2% |
| Immigrants | Jordan | 77.0 /100 | #155 | Good 96.2% |
| Kenyans | 76.2 /100 | #156 | Good 96.2% |
| Ugandans | 75.5 /100 | #157 | Good 96.2% |
| Arabs | 68.6 /100 | #158 | Good 96.2% |
| Alsatians | 67.2 /100 | #159 | Good 96.1% |
| Immigrants | Kenya | 66.8 /100 | #160 | Good 96.1% |
| Bermudans | 66.3 /100 | #161 | Good 96.1% |
| Pima | 64.3 /100 | #162 | Good 96.1% |
| Spaniards | 62.6 /100 | #163 | Good 96.1% |
| Immigrants | Italy | 62.1 /100 | #164 | Good 96.1% |
| Immigrants | Taiwan | 61.5 /100 | #165 | Good 96.1% |
| Immigrants | Kazakhstan | 61.0 /100 | #166 | Good 96.1% |