Icelander vs Immigrants from Latin America Doctorate Degree
COMPARE
Icelander
Immigrants from Latin America
Doctorate Degree
Doctorate Degree Comparison
Icelanders
Immigrants from Latin America
2.1%
DOCTORATE DEGREE
96.0/ 100
METRIC RATING
118th/ 347
METRIC RANK
1.3%
DOCTORATE DEGREE
0.0/ 100
METRIC RATING
331st/ 347
METRIC RANK
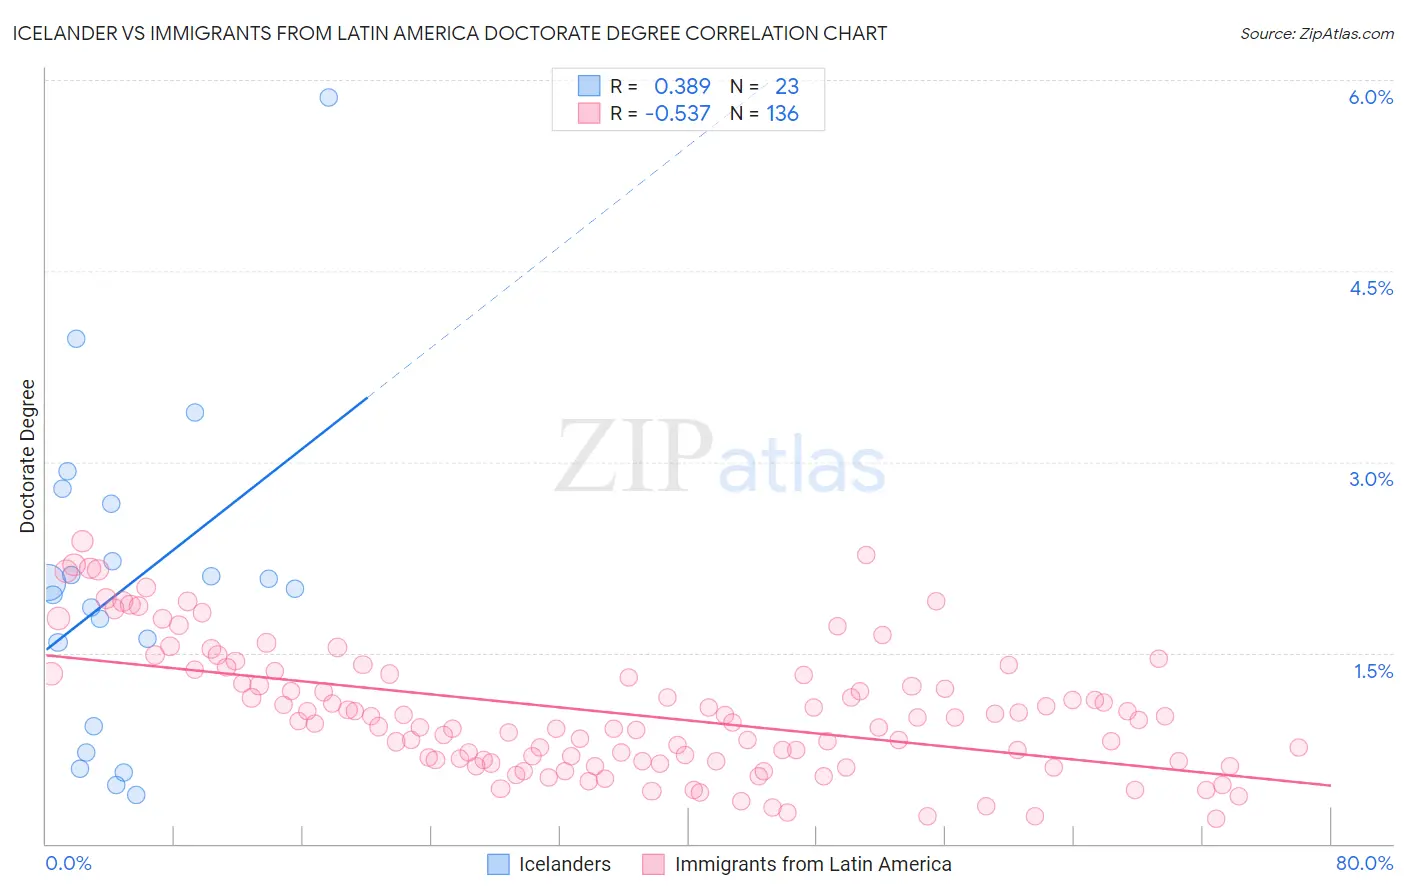
Icelander vs Immigrants from Latin America Doctorate Degree Correlation Chart
The statistical analysis conducted on geographies consisting of 159,042,480 people shows a mild positive correlation between the proportion of Icelanders and percentage of population with at least doctorate degree education in the United States with a correlation coefficient (R) of 0.389 and weighted average of 2.1%. Similarly, the statistical analysis conducted on geographies consisting of 538,199,058 people shows a substantial negative correlation between the proportion of Immigrants from Latin America and percentage of population with at least doctorate degree education in the United States with a correlation coefficient (R) of -0.537 and weighted average of 1.3%, a difference of 57.5%.
Doctorate Degree Correlation Summary
| Measurement | Icelander | Immigrants from Latin America |
| Minimum | 0.38% | 0.19% |
| Maximum | 5.9% | 2.4% |
| Range | 5.5% | 2.2% |
| Mean | 2.0% | 1.0% |
| Median | 2.0% | 0.97% |
| Interquartile 25% (IQ1) | 0.93% | 0.65% |
| Interquartile 75% (IQ3) | 2.7% | 1.3% |
| Interquartile Range (IQR) | 1.7% | 0.68% |
| Standard Deviation (Sample) | 1.3% | 0.50% |
| Standard Deviation (Population) | 1.2% | 0.50% |
Similar Demographics by Doctorate Degree
Demographics Similar to Icelanders by Doctorate Degree
In terms of doctorate degree, the demographic groups most similar to Icelanders are Lebanese (2.1%, a difference of 0.040%), Pakistani (2.0%, a difference of 0.13%), Maltese (2.1%, a difference of 0.21%), Immigrants from Morocco (2.0%, a difference of 0.42%), and Taiwanese (2.1%, a difference of 0.67%).
| Demographics | Rating | Rank | Doctorate Degree |
| Immigrants | Pakistan | 97.1 /100 | #111 | Exceptional 2.1% |
| Syrians | 97.1 /100 | #112 | Exceptional 2.1% |
| Immigrants | Italy | 96.9 /100 | #113 | Exceptional 2.1% |
| Immigrants | Croatia | 96.8 /100 | #114 | Exceptional 2.1% |
| Taiwanese | 96.7 /100 | #115 | Exceptional 2.1% |
| Maltese | 96.2 /100 | #116 | Exceptional 2.1% |
| Lebanese | 96.0 /100 | #117 | Exceptional 2.1% |
| Icelanders | 96.0 /100 | #118 | Exceptional 2.1% |
| Pakistanis | 95.8 /100 | #119 | Exceptional 2.0% |
| Immigrants | Morocco | 95.5 /100 | #120 | Exceptional 2.0% |
| Immigrants | Jordan | 94.8 /100 | #121 | Exceptional 2.0% |
| Immigrants | Southern Europe | 94.7 /100 | #122 | Exceptional 2.0% |
| Croatians | 94.0 /100 | #123 | Exceptional 2.0% |
| Ute | 93.2 /100 | #124 | Exceptional 2.0% |
| Moroccans | 93.0 /100 | #125 | Exceptional 2.0% |
Demographics Similar to Immigrants from Latin America by Doctorate Degree
In terms of doctorate degree, the demographic groups most similar to Immigrants from Latin America are Yup'ik (1.3%, a difference of 0.010%), Haitian (1.3%, a difference of 0.23%), Inupiat (1.3%, a difference of 0.28%), Hispanic or Latino (1.3%, a difference of 0.86%), and Immigrants from Cabo Verde (1.3%, a difference of 1.1%).
| Demographics | Rating | Rank | Doctorate Degree |
| Natives/Alaskans | 0.0 /100 | #324 | Tragic 1.3% |
| Pima | 0.0 /100 | #325 | Tragic 1.3% |
| Immigrants | Cabo Verde | 0.0 /100 | #326 | Tragic 1.3% |
| Hispanics or Latinos | 0.0 /100 | #327 | Tragic 1.3% |
| Inupiat | 0.0 /100 | #328 | Tragic 1.3% |
| Haitians | 0.0 /100 | #329 | Tragic 1.3% |
| Yup'ik | 0.0 /100 | #330 | Tragic 1.3% |
| Immigrants | Latin America | 0.0 /100 | #331 | Tragic 1.3% |
| Yakama | 0.0 /100 | #332 | Tragic 1.3% |
| Immigrants | Caribbean | 0.0 /100 | #333 | Tragic 1.3% |
| Immigrants | Dominican Republic | 0.0 /100 | #334 | Tragic 1.3% |
| Immigrants | Haiti | 0.0 /100 | #335 | Tragic 1.3% |
| Nepalese | 0.0 /100 | #336 | Tragic 1.3% |
| Bangladeshis | 0.0 /100 | #337 | Tragic 1.2% |
| Puget Sound Salish | 0.0 /100 | #338 | Tragic 1.2% |