Pennsylvania German vs Immigrants from Latin America Doctorate Degree
COMPARE
Pennsylvania German
Immigrants from Latin America
Doctorate Degree
Doctorate Degree Comparison
Pennsylvania Germans
Immigrants from Latin America
1.4%
DOCTORATE DEGREE
0.1/ 100
METRIC RATING
305th/ 347
METRIC RANK
1.3%
DOCTORATE DEGREE
0.0/ 100
METRIC RATING
331st/ 347
METRIC RANK
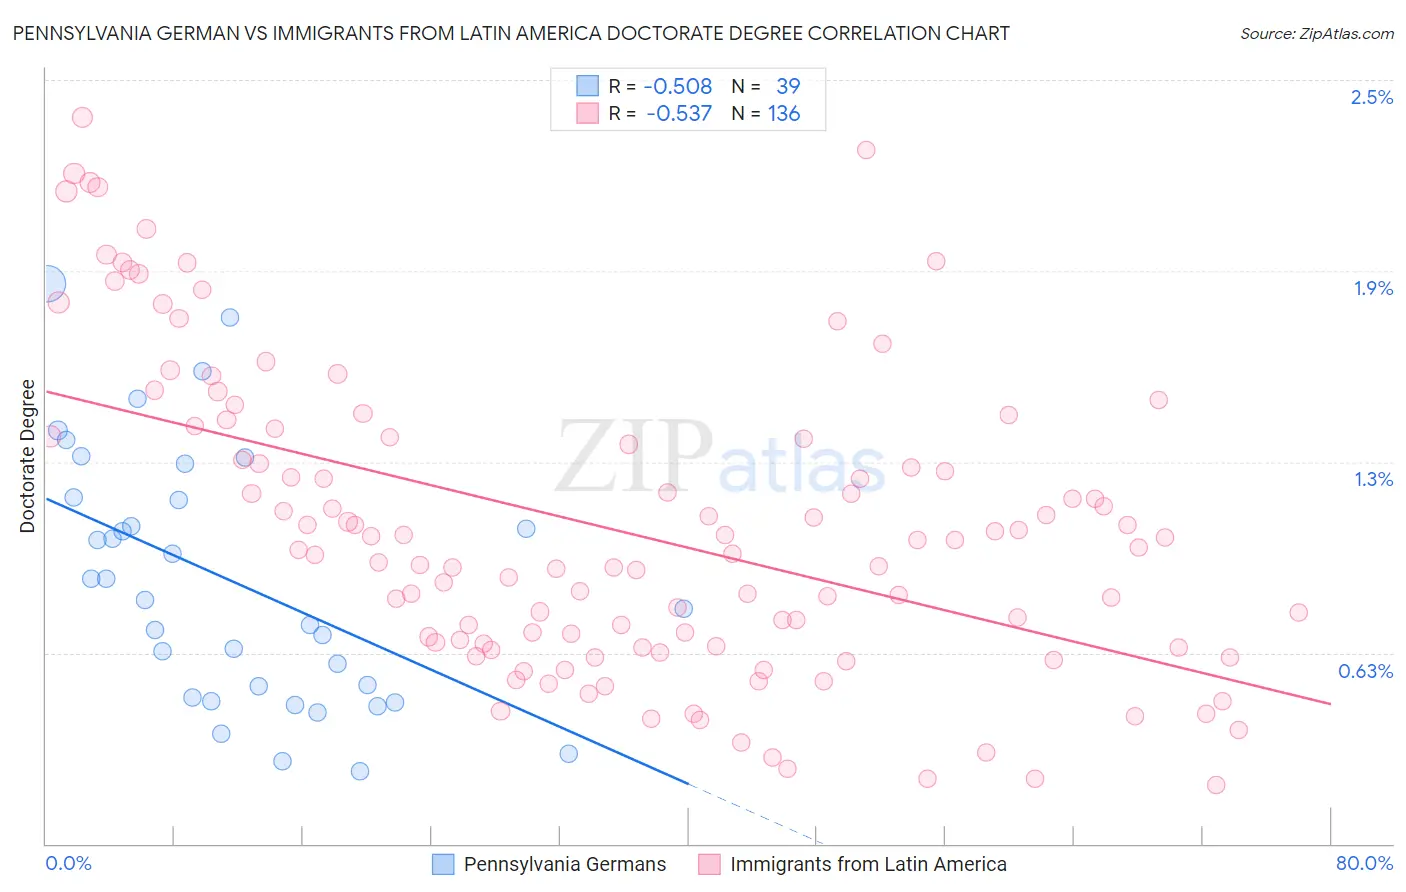
Pennsylvania German vs Immigrants from Latin America Doctorate Degree Correlation Chart
The statistical analysis conducted on geographies consisting of 230,381,688 people shows a substantial negative correlation between the proportion of Pennsylvania Germans and percentage of population with at least doctorate degree education in the United States with a correlation coefficient (R) of -0.508 and weighted average of 1.4%. Similarly, the statistical analysis conducted on geographies consisting of 538,199,058 people shows a substantial negative correlation between the proportion of Immigrants from Latin America and percentage of population with at least doctorate degree education in the United States with a correlation coefficient (R) of -0.537 and weighted average of 1.3%, a difference of 5.9%.
Doctorate Degree Correlation Summary
| Measurement | Pennsylvania German | Immigrants from Latin America |
| Minimum | 0.24% | 0.19% |
| Maximum | 1.8% | 2.4% |
| Range | 1.6% | 2.2% |
| Mean | 0.86% | 1.0% |
| Median | 0.80% | 0.97% |
| Interquartile 25% (IQ1) | 0.48% | 0.65% |
| Interquartile 75% (IQ3) | 1.1% | 1.3% |
| Interquartile Range (IQR) | 0.65% | 0.68% |
| Standard Deviation (Sample) | 0.41% | 0.50% |
| Standard Deviation (Population) | 0.41% | 0.50% |
Similar Demographics by Doctorate Degree
Demographics Similar to Pennsylvania Germans by Doctorate Degree
In terms of doctorate degree, the demographic groups most similar to Pennsylvania Germans are Guyanese (1.4%, a difference of 0.010%), Mexican American Indian (1.4%, a difference of 0.13%), Immigrants from Dominica (1.4%, a difference of 0.19%), Shoshone (1.4%, a difference of 0.22%), and Cuban (1.4%, a difference of 0.26%).
| Demographics | Rating | Rank | Doctorate Degree |
| Puerto Ricans | 0.1 /100 | #298 | Tragic 1.4% |
| Belizeans | 0.1 /100 | #299 | Tragic 1.4% |
| Immigrants | Guatemala | 0.1 /100 | #300 | Tragic 1.4% |
| Hondurans | 0.1 /100 | #301 | Tragic 1.4% |
| Shoshone | 0.1 /100 | #302 | Tragic 1.4% |
| Immigrants | Dominica | 0.1 /100 | #303 | Tragic 1.4% |
| Mexican American Indians | 0.1 /100 | #304 | Tragic 1.4% |
| Pennsylvania Germans | 0.1 /100 | #305 | Tragic 1.4% |
| Guyanese | 0.1 /100 | #306 | Tragic 1.4% |
| Cubans | 0.1 /100 | #307 | Tragic 1.4% |
| Immigrants | Laos | 0.1 /100 | #308 | Tragic 1.4% |
| Immigrants | Grenada | 0.1 /100 | #309 | Tragic 1.4% |
| Immigrants | Jamaica | 0.1 /100 | #310 | Tragic 1.4% |
| Immigrants | Honduras | 0.1 /100 | #311 | Tragic 1.4% |
| Immigrants | Nicaragua | 0.1 /100 | #312 | Tragic 1.4% |
Demographics Similar to Immigrants from Latin America by Doctorate Degree
In terms of doctorate degree, the demographic groups most similar to Immigrants from Latin America are Yup'ik (1.3%, a difference of 0.010%), Haitian (1.3%, a difference of 0.23%), Inupiat (1.3%, a difference of 0.28%), Hispanic or Latino (1.3%, a difference of 0.86%), and Immigrants from Cabo Verde (1.3%, a difference of 1.1%).
| Demographics | Rating | Rank | Doctorate Degree |
| Natives/Alaskans | 0.0 /100 | #324 | Tragic 1.3% |
| Pima | 0.0 /100 | #325 | Tragic 1.3% |
| Immigrants | Cabo Verde | 0.0 /100 | #326 | Tragic 1.3% |
| Hispanics or Latinos | 0.0 /100 | #327 | Tragic 1.3% |
| Inupiat | 0.0 /100 | #328 | Tragic 1.3% |
| Haitians | 0.0 /100 | #329 | Tragic 1.3% |
| Yup'ik | 0.0 /100 | #330 | Tragic 1.3% |
| Immigrants | Latin America | 0.0 /100 | #331 | Tragic 1.3% |
| Yakama | 0.0 /100 | #332 | Tragic 1.3% |
| Immigrants | Caribbean | 0.0 /100 | #333 | Tragic 1.3% |
| Immigrants | Dominican Republic | 0.0 /100 | #334 | Tragic 1.3% |
| Immigrants | Haiti | 0.0 /100 | #335 | Tragic 1.3% |
| Nepalese | 0.0 /100 | #336 | Tragic 1.3% |
| Bangladeshis | 0.0 /100 | #337 | Tragic 1.2% |
| Puget Sound Salish | 0.0 /100 | #338 | Tragic 1.2% |