Liberian vs Immigrants from Latin America Doctorate Degree
COMPARE
Liberian
Immigrants from Latin America
Doctorate Degree
Doctorate Degree Comparison
Liberians
Immigrants from Latin America
1.5%
DOCTORATE DEGREE
0.9/ 100
METRIC RATING
259th/ 347
METRIC RANK
1.3%
DOCTORATE DEGREE
0.0/ 100
METRIC RATING
331st/ 347
METRIC RANK
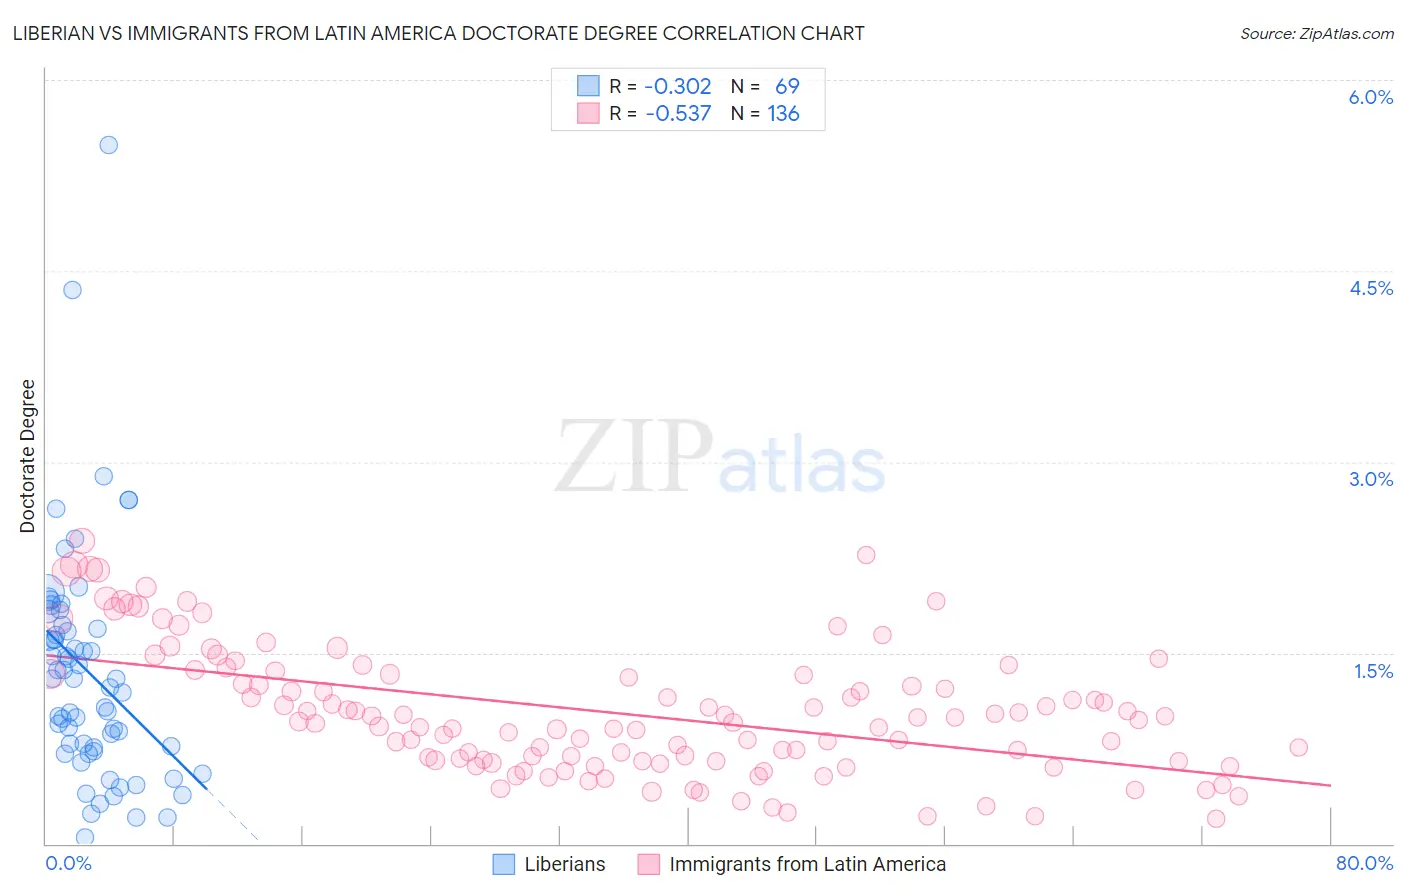
Liberian vs Immigrants from Latin America Doctorate Degree Correlation Chart
The statistical analysis conducted on geographies consisting of 117,723,889 people shows a mild negative correlation between the proportion of Liberians and percentage of population with at least doctorate degree education in the United States with a correlation coefficient (R) of -0.302 and weighted average of 1.5%. Similarly, the statistical analysis conducted on geographies consisting of 538,199,058 people shows a substantial negative correlation between the proportion of Immigrants from Latin America and percentage of population with at least doctorate degree education in the United States with a correlation coefficient (R) of -0.537 and weighted average of 1.3%, a difference of 16.6%.
Doctorate Degree Correlation Summary
| Measurement | Liberian | Immigrants from Latin America |
| Minimum | 0.049% | 0.19% |
| Maximum | 5.5% | 2.4% |
| Range | 5.4% | 2.2% |
| Mean | 1.3% | 1.0% |
| Median | 1.3% | 0.97% |
| Interquartile 25% (IQ1) | 0.74% | 0.65% |
| Interquartile 75% (IQ3) | 1.7% | 1.3% |
| Interquartile Range (IQR) | 0.96% | 0.68% |
| Standard Deviation (Sample) | 0.92% | 0.50% |
| Standard Deviation (Population) | 0.91% | 0.50% |
Similar Demographics by Doctorate Degree
Demographics Similar to Liberians by Doctorate Degree
In terms of doctorate degree, the demographic groups most similar to Liberians are Immigrants from West Indies (1.5%, a difference of 0.030%), Japanese (1.5%, a difference of 0.10%), Chippewa (1.5%, a difference of 0.28%), Central American Indian (1.5%, a difference of 0.51%), and Trinidadian and Tobagonian (1.5%, a difference of 0.55%).
| Demographics | Rating | Rank | Doctorate Degree |
| Yuman | 1.1 /100 | #252 | Tragic 1.5% |
| Americans | 1.0 /100 | #253 | Tragic 1.5% |
| Immigrants | Cambodia | 1.0 /100 | #254 | Tragic 1.5% |
| Trinidadians and Tobagonians | 1.0 /100 | #255 | Tragic 1.5% |
| Central American Indians | 1.0 /100 | #256 | Tragic 1.5% |
| Chippewa | 0.9 /100 | #257 | Tragic 1.5% |
| Immigrants | West Indies | 0.9 /100 | #258 | Tragic 1.5% |
| Liberians | 0.9 /100 | #259 | Tragic 1.5% |
| Japanese | 0.9 /100 | #260 | Tragic 1.5% |
| Immigrants | Portugal | 0.8 /100 | #261 | Tragic 1.5% |
| Chickasaw | 0.7 /100 | #262 | Tragic 1.5% |
| Immigrants | Bahamas | 0.7 /100 | #263 | Tragic 1.5% |
| Blackfeet | 0.7 /100 | #264 | Tragic 1.5% |
| Nicaraguans | 0.6 /100 | #265 | Tragic 1.5% |
| Immigrants | Liberia | 0.5 /100 | #266 | Tragic 1.5% |
Demographics Similar to Immigrants from Latin America by Doctorate Degree
In terms of doctorate degree, the demographic groups most similar to Immigrants from Latin America are Yup'ik (1.3%, a difference of 0.010%), Haitian (1.3%, a difference of 0.23%), Inupiat (1.3%, a difference of 0.28%), Hispanic or Latino (1.3%, a difference of 0.86%), and Immigrants from Cabo Verde (1.3%, a difference of 1.1%).
| Demographics | Rating | Rank | Doctorate Degree |
| Natives/Alaskans | 0.0 /100 | #324 | Tragic 1.3% |
| Pima | 0.0 /100 | #325 | Tragic 1.3% |
| Immigrants | Cabo Verde | 0.0 /100 | #326 | Tragic 1.3% |
| Hispanics or Latinos | 0.0 /100 | #327 | Tragic 1.3% |
| Inupiat | 0.0 /100 | #328 | Tragic 1.3% |
| Haitians | 0.0 /100 | #329 | Tragic 1.3% |
| Yup'ik | 0.0 /100 | #330 | Tragic 1.3% |
| Immigrants | Latin America | 0.0 /100 | #331 | Tragic 1.3% |
| Yakama | 0.0 /100 | #332 | Tragic 1.3% |
| Immigrants | Caribbean | 0.0 /100 | #333 | Tragic 1.3% |
| Immigrants | Dominican Republic | 0.0 /100 | #334 | Tragic 1.3% |
| Immigrants | Haiti | 0.0 /100 | #335 | Tragic 1.3% |
| Nepalese | 0.0 /100 | #336 | Tragic 1.3% |
| Bangladeshis | 0.0 /100 | #337 | Tragic 1.2% |
| Puget Sound Salish | 0.0 /100 | #338 | Tragic 1.2% |