Italian vs Immigrants from Laos Hearing Disability
COMPARE
Italian
Immigrants from Laos
Hearing Disability
Hearing Disability Comparison
Italians
Immigrants from Laos
3.4%
HEARING DISABILITY
0.4/ 100
METRIC RATING
249th/ 347
METRIC RANK
3.2%
HEARING DISABILITY
6.6/ 100
METRIC RATING
221st/ 347
METRIC RANK
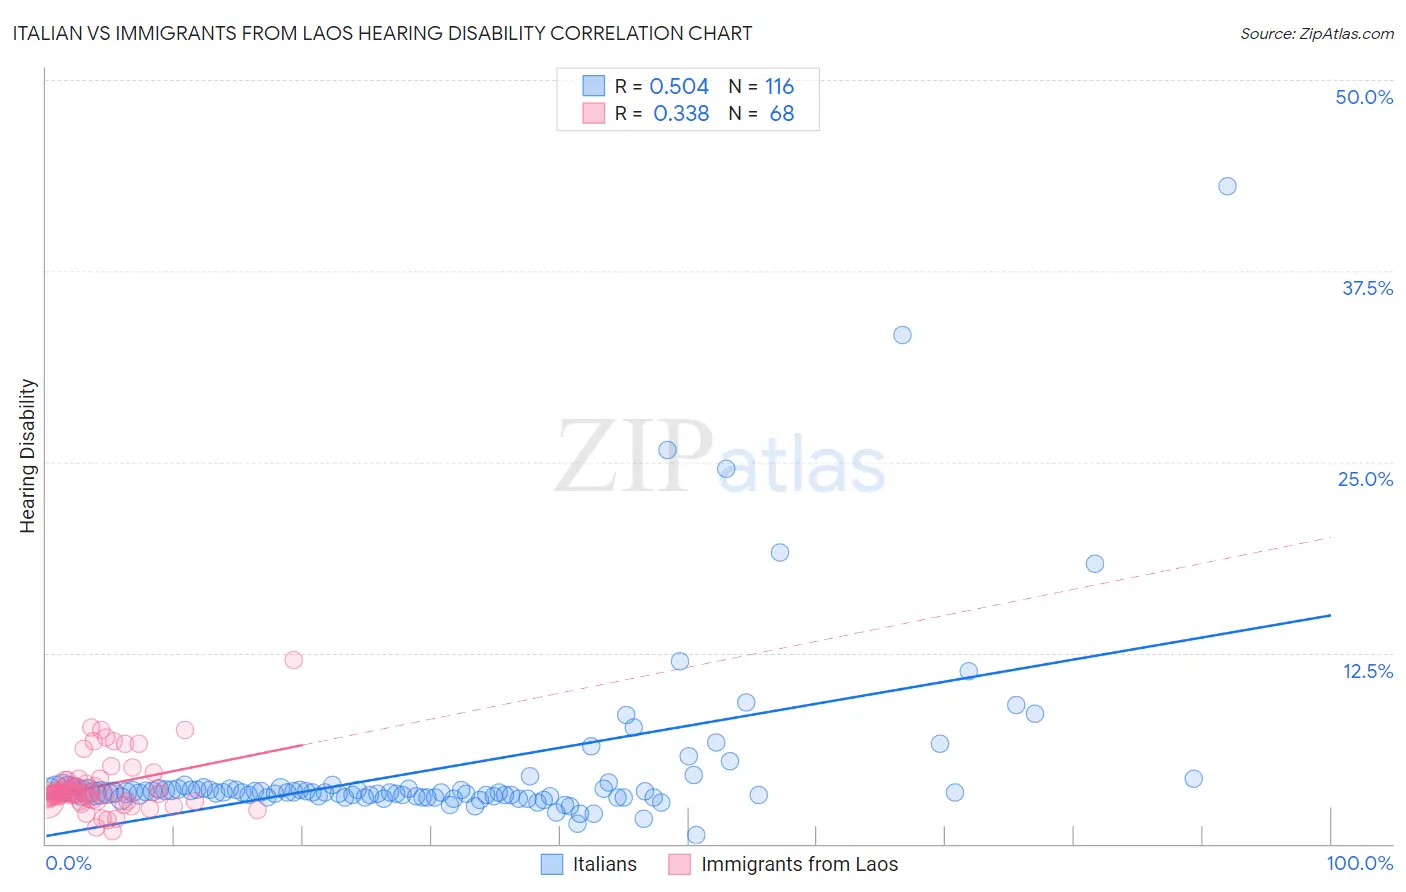
Italian vs Immigrants from Laos Hearing Disability Correlation Chart
The statistical analysis conducted on geographies consisting of 574,261,406 people shows a substantial positive correlation between the proportion of Italians and percentage of population with hearing disability in the United States with a correlation coefficient (R) of 0.504 and weighted average of 3.4%. Similarly, the statistical analysis conducted on geographies consisting of 201,463,396 people shows a mild positive correlation between the proportion of Immigrants from Laos and percentage of population with hearing disability in the United States with a correlation coefficient (R) of 0.338 and weighted average of 3.2%, a difference of 6.1%.
Hearing Disability Correlation Summary
| Measurement | Italian | Immigrants from Laos |
| Minimum | 0.61% | 0.79% |
| Maximum | 43.0% | 12.0% |
| Range | 42.4% | 11.2% |
| Mean | 5.0% | 3.8% |
| Median | 3.4% | 3.3% |
| Interquartile 25% (IQ1) | 3.1% | 2.9% |
| Interquartile 75% (IQ3) | 3.6% | 4.0% |
| Interquartile Range (IQR) | 0.52% | 1.2% |
| Standard Deviation (Sample) | 5.9% | 1.8% |
| Standard Deviation (Population) | 5.8% | 1.8% |
Similar Demographics by Hearing Disability
Demographics Similar to Italians by Hearing Disability
In terms of hearing disability, the demographic groups most similar to Italians are Yuman (3.4%, a difference of 0.010%), Hungarian (3.4%, a difference of 0.24%), Croatian (3.4%, a difference of 0.45%), Austrian (3.4%, a difference of 0.53%), and Lithuanian (3.4%, a difference of 0.75%).
| Demographics | Rating | Rank | Hearing Disability |
| Yugoslavians | 1.0 /100 | #242 | Tragic 3.3% |
| Immigrants | Western Europe | 1.0 /100 | #243 | Tragic 3.3% |
| Assyrians/Chaldeans/Syriacs | 0.9 /100 | #244 | Tragic 3.3% |
| Immigrants | Scotland | 0.8 /100 | #245 | Tragic 3.3% |
| Immigrants | England | 0.7 /100 | #246 | Tragic 3.3% |
| Lithuanians | 0.6 /100 | #247 | Tragic 3.4% |
| Austrians | 0.6 /100 | #248 | Tragic 3.4% |
| Italians | 0.4 /100 | #249 | Tragic 3.4% |
| Yuman | 0.4 /100 | #250 | Tragic 3.4% |
| Hungarians | 0.4 /100 | #251 | Tragic 3.4% |
| Croatians | 0.4 /100 | #252 | Tragic 3.4% |
| Carpatho Rusyns | 0.3 /100 | #253 | Tragic 3.4% |
| Slavs | 0.2 /100 | #254 | Tragic 3.4% |
| Poles | 0.2 /100 | #255 | Tragic 3.4% |
| Hmong | 0.2 /100 | #256 | Tragic 3.4% |
Demographics Similar to Immigrants from Laos by Hearing Disability
In terms of hearing disability, the demographic groups most similar to Immigrants from Laos are Malaysian (3.2%, a difference of 0.0%), Immigrants from Oceania (3.2%, a difference of 0.040%), New Zealander (3.2%, a difference of 0.060%), Immigrants from Northern Europe (3.2%, a difference of 0.12%), and Russian (3.2%, a difference of 0.16%).
| Demographics | Rating | Rank | Hearing Disability |
| Australians | 8.1 /100 | #214 | Tragic 3.2% |
| Bangladeshis | 8.1 /100 | #215 | Tragic 3.2% |
| Immigrants | Norway | 7.3 /100 | #216 | Tragic 3.2% |
| Russians | 7.1 /100 | #217 | Tragic 3.2% |
| Immigrants | Northern Europe | 7.0 /100 | #218 | Tragic 3.2% |
| New Zealanders | 6.8 /100 | #219 | Tragic 3.2% |
| Malaysians | 6.6 /100 | #220 | Tragic 3.2% |
| Immigrants | Laos | 6.6 /100 | #221 | Tragic 3.2% |
| Immigrants | Oceania | 6.5 /100 | #222 | Tragic 3.2% |
| Mexicans | 5.6 /100 | #223 | Tragic 3.2% |
| Icelanders | 5.2 /100 | #224 | Tragic 3.2% |
| Latvians | 5.1 /100 | #225 | Tragic 3.2% |
| Lebanese | 5.0 /100 | #226 | Tragic 3.2% |
| Bhutanese | 4.6 /100 | #227 | Tragic 3.2% |
| Immigrants | Portugal | 4.3 /100 | #228 | Tragic 3.2% |